WProConnect(@wproconnect) 's Twitter Profile Photo

New Residential Construction

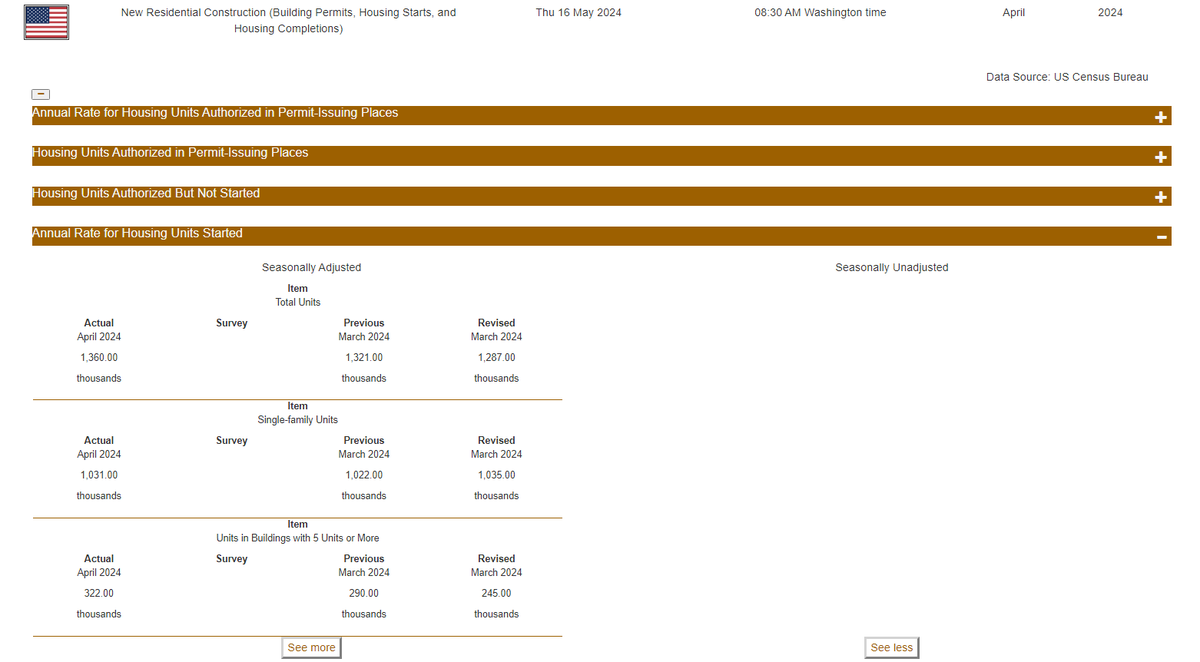
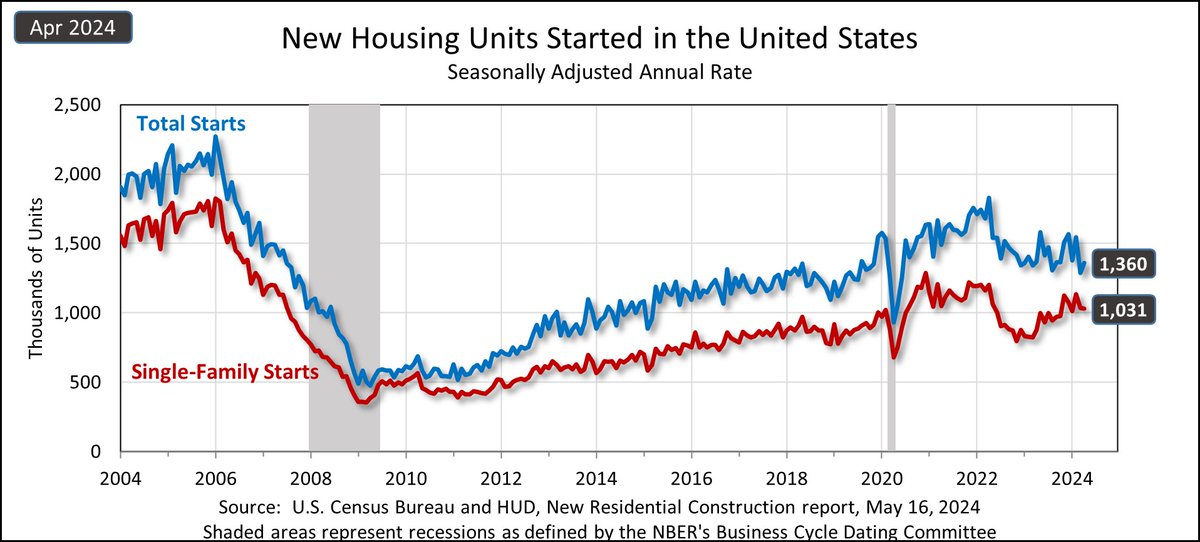
Privately-owned housing starts in Apr4 were at a seasonally adjusted annual rate of 1,360,000. This is 5.7% above the revised Mar24 estimate of 1,287,000.

Apr24: +5.7* % Change
Mar24 (r): -16.8 % Change

Source: US Bureau

EconData

New Residential Construction

Privately-owned housing starts in Apr4 were at a seasonally adjusted annual rate of 1,360,000.  This is 5.7% above the revised Mar24 estimate of 1,287,000.

Apr24: +5.7* % Change
Mar24 (r): -16.8 % Change

Source: US #Census Bureau

#CensusEconData
account_circle
WProConnect(@wproconnect) 's Twitter Profile Photo

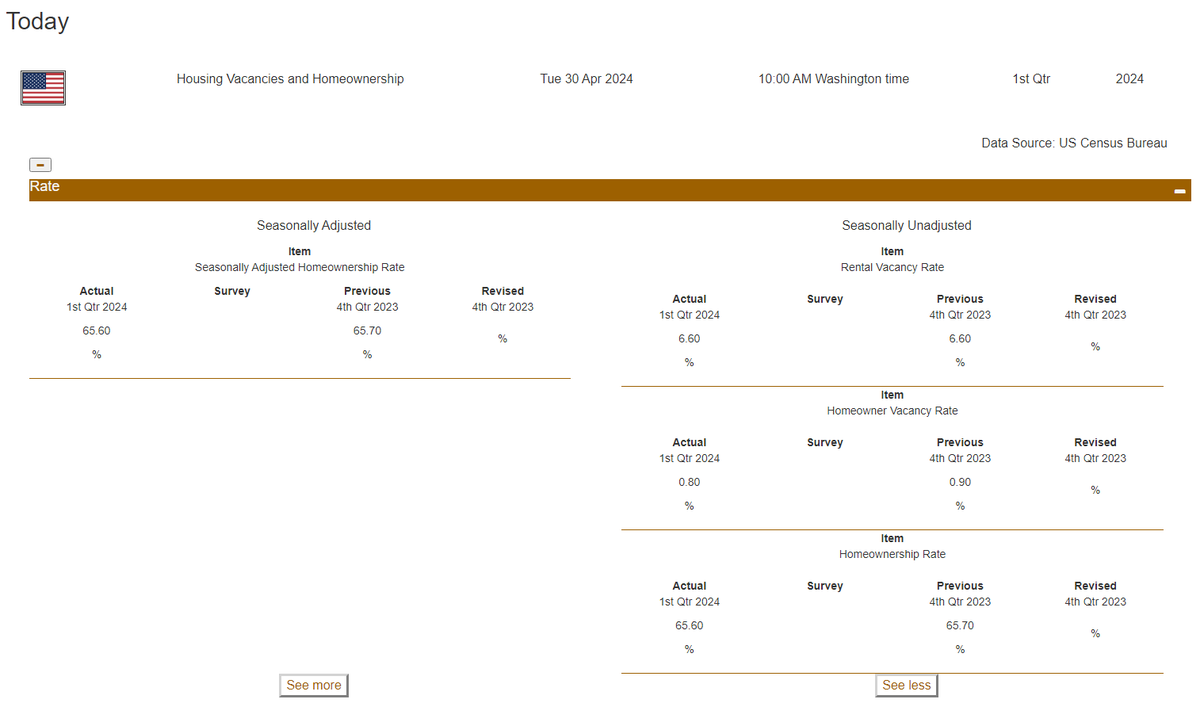
Rental Vacancy Rate

The rental vacancy rate of 6.6 percent was not statistically different than the rate in the 1Q23 (6.4 percent).

1st Qtr 2024: +6.6* Percent
1st Qtr 2023: +6.4 Percent

Source: US Bureau

EconData

Rental Vacancy Rate

The rental vacancy rate of 6.6 percent was not statistically different than the rate in the 1Q23 (6.4 percent). 

1st Qtr 2024: +6.6* Percent
1st Qtr 2023: +6.4 Percent

Source: US #Census Bureau

#CensusEconData
account_circle
WProConnect(@wproconnect) 's Twitter Profile Photo

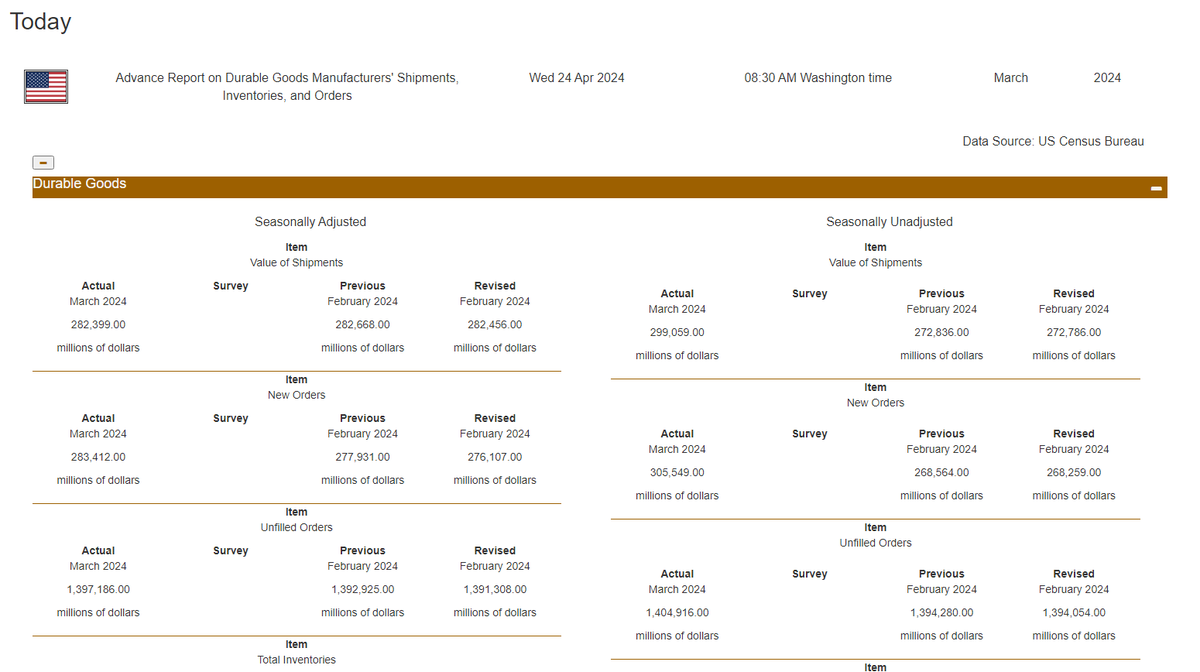
Advance Monthly Manufacturers' Shipments, Inventories, and Orders

New orders for manufactured durable goods in March, up two consecutive months, increased $7.3B or 2.6% to $283.4B.

Mar24: +2.6° % Change
Feb24 (r): +0.7° % Change

Source: US Bureau

EconData

Advance Monthly Manufacturers' Shipments, Inventories, and Orders

New orders for manufactured durable goods in March, up two consecutive months, increased $7.3B or 2.6% to $283.4B.

Mar24: +2.6° % Change
Feb24 (r): +0.7° % Change

Source: US #Census Bureau

#CensusEconData
account_circle
WProConnect(@wproconnect) 's Twitter Profile Photo

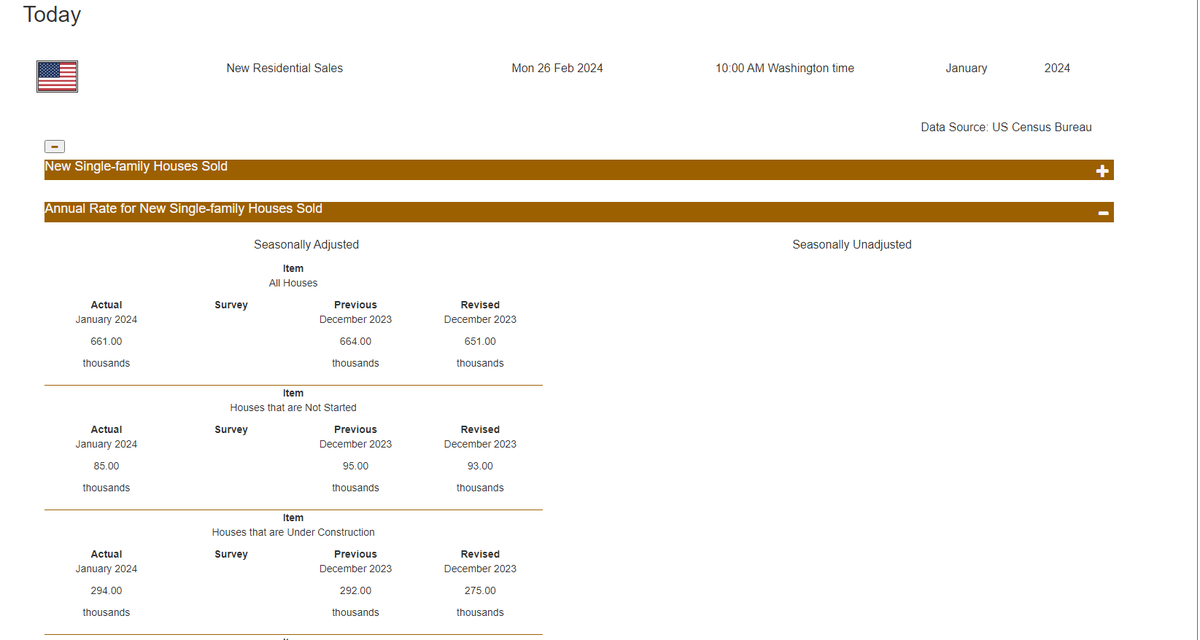
New Home Sales

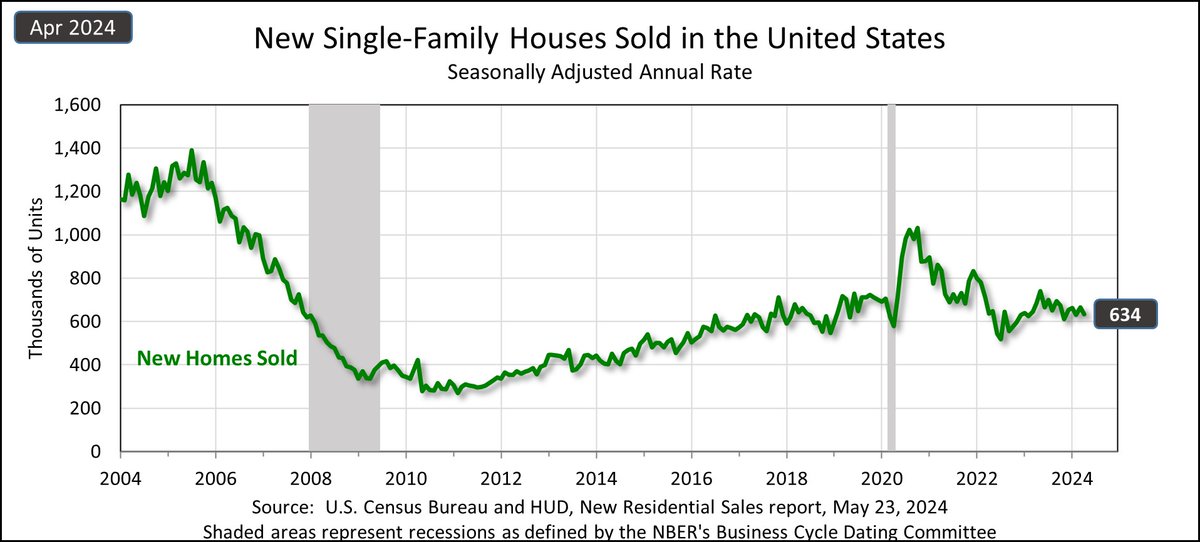
Sales of new single-family houses in Jan24 were at a seasonally adjusted annual rate of 661,000. This is 1.5% above the revised Dec23 estimate of 651,000.

Jan24: +1.5* % Change
Dec23 (r): +7.2* % Change

Source: US Bureau

EconData

New Home Sales

Sales of new single-family houses in Jan24 were at a seasonally adjusted annual rate of 661,000.  This is 1.5% above the revised Dec23 estimate of 651,000.

Jan24: +1.5* % Change
Dec23 (r): +7.2* % Change

Source: US #Census Bureau

#CensusEconData #wproconnect
account_circle
WProConnect(@wproconnect) 's Twitter Profile Photo

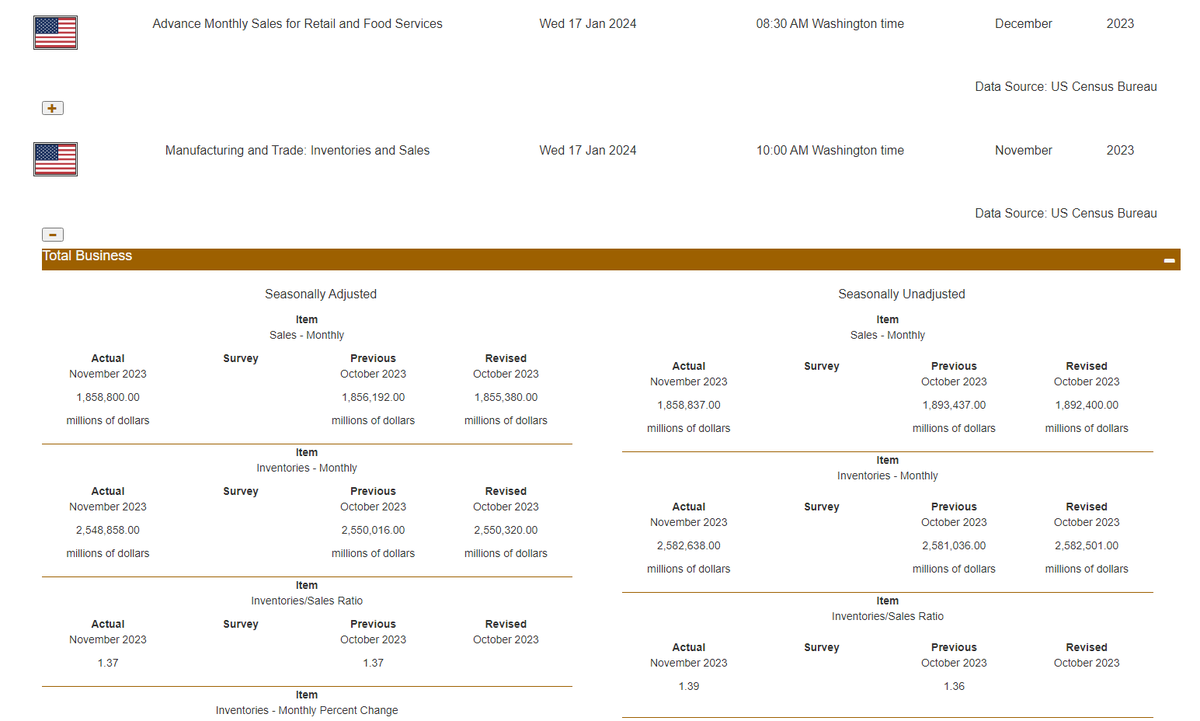
Manufacturing and Trade Inventories and Sales

U.S. total business end-of-month inventories for Nov23 were $2,548.9B, down 0.1% from last month. U.S. total business sales were $1,858.8B, up 0.2% from last month.

Source: US Bureau

EconData

Manufacturing and Trade Inventories and Sales

U.S. total business end-of-month inventories for Nov23 were $2,548.9B, down 0.1%  from last month. U.S. total business sales were $1,858.8B, up 0.2% from last month.

Source: US #Census Bureau

#CensusEconData #wproconnect
account_circle
WProConnect(@wproconnect) 's Twitter Profile Photo

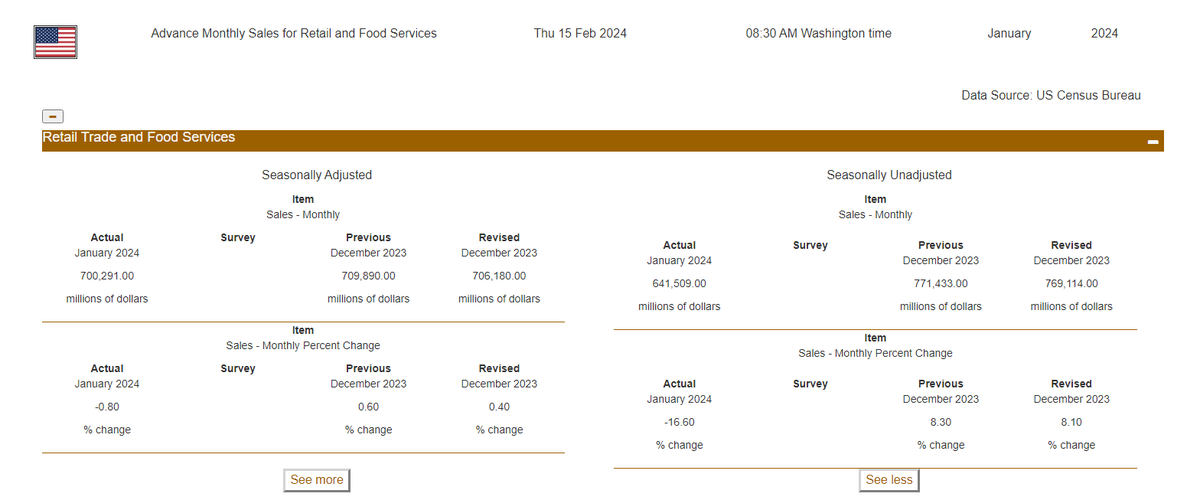
Advance Monthly Sales for Retail and Food Services

U.S. retail and food services sales for January 2024 were $700.3 billion, down 0.8% from the previous month.

January 2024: -0.8 % Change
December 2023 (r): +0.4 % Change

Source: US Bureau

EconData

Advance Monthly Sales for Retail and Food Services

U.S. retail and food services sales for January 2024 were $700.3 billion, down 0.8% from the previous month.

January 2024: -0.8 % Change
December 2023 (r): +0.4 % Change

Source: US #Census  Bureau

#CensusEconData #wproconnect
account_circle
WProConnect(@wproconnect) 's Twitter Profile Photo

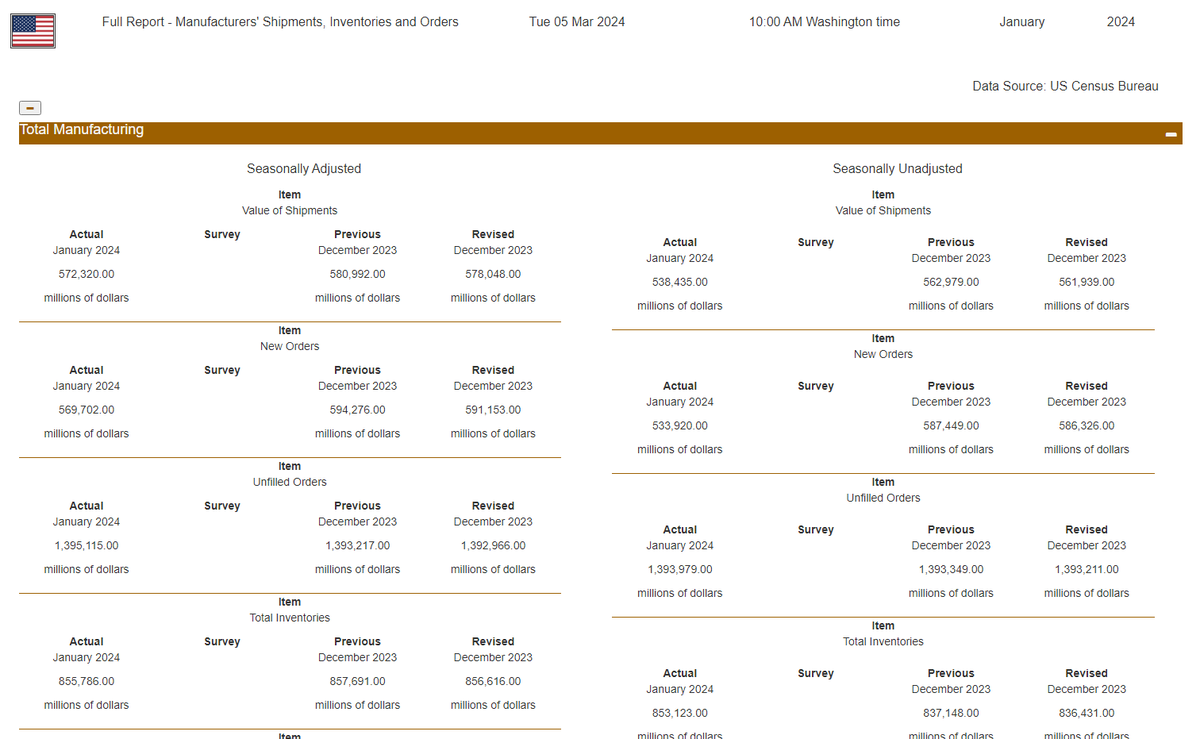
Manufacturers' Shipments, Inventories, and Orders

New orders for manufactured goods in January, down three of the last four months, decreased $21.5B or 3.6% to $569.7B.

Jan24: -3.6° % Change
Dec23 (r): -0.3° % Change

Source: US Bureau

EconData

Manufacturers' Shipments, Inventories, and Orders

New orders for manufactured goods in January, down three of the last four months, decreased $21.5B or 3.6% to $569.7B.

Jan24: -3.6° % Change
Dec23 (r): -0.3° % Change

Source: US #Census Bureau

#CensusEconData #wproconnect
account_circle
WProConnect(@wproconnect) 's Twitter Profile Photo

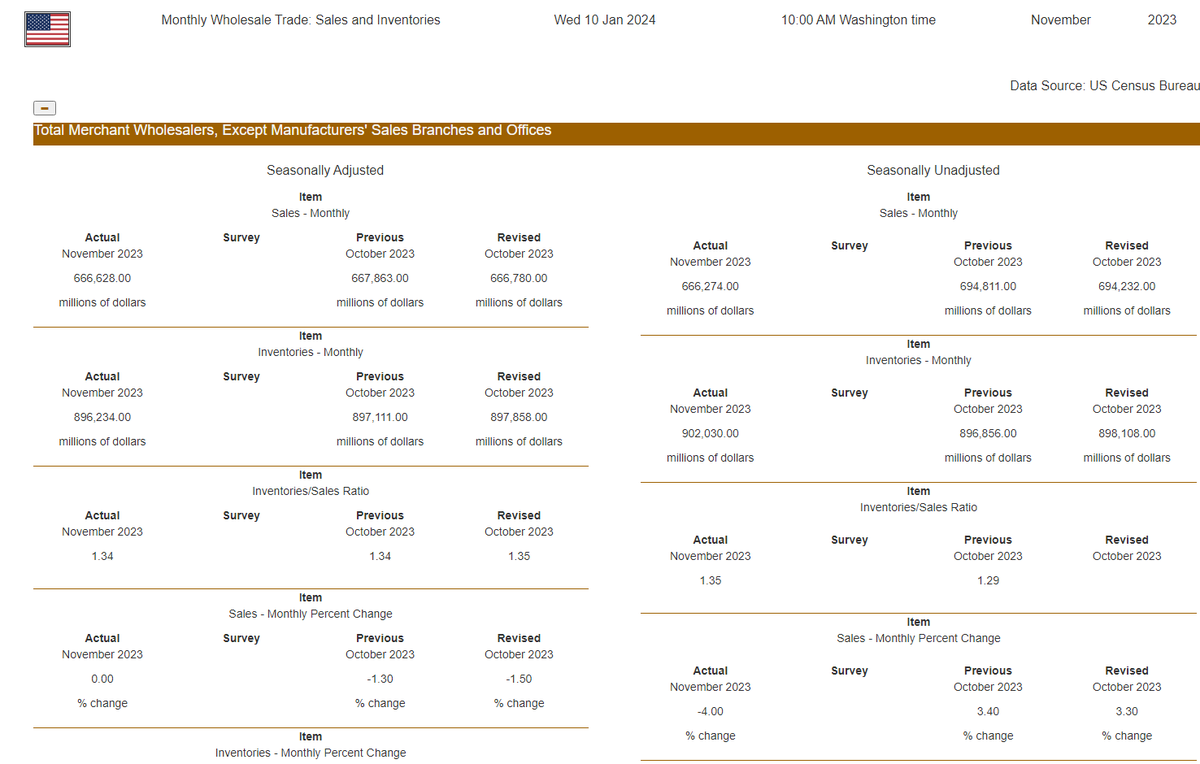
Sales and Inventories

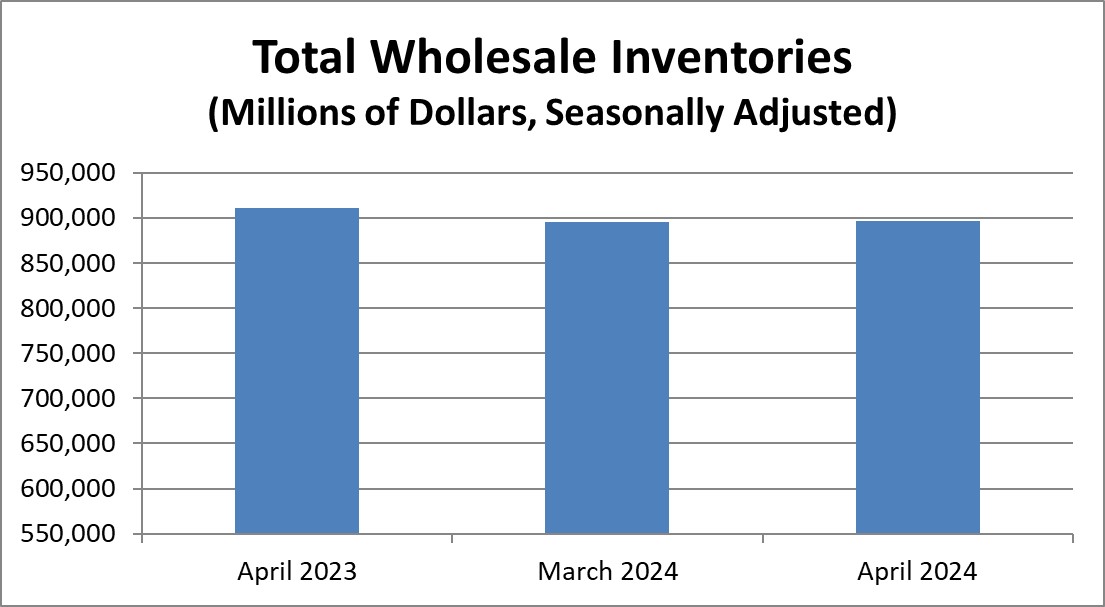
Nov23 sales of merchant wholesalers were $666.6 billion, virtually unchanged from last month.
Nov23: -0.2* % Change in Inventories
Oct23 (r): -0.3* % Change in Inventories

Data Source: US Census Bureau

wproconnect.com/economic-calen…

Sales and Inventories

Nov23 sales of merchant wholesalers were $666.6 billion, virtually unchanged  from last month. 
Nov23: -0.2* % Change in Inventories
Oct23 (r): -0.3* % Change in Inventories

Data Source: US Census Bureau

wproconnect.com/economic-calen…

#economy #CensusEconData
account_circle
WProConnect(@wproconnect) 's Twitter Profile Photo

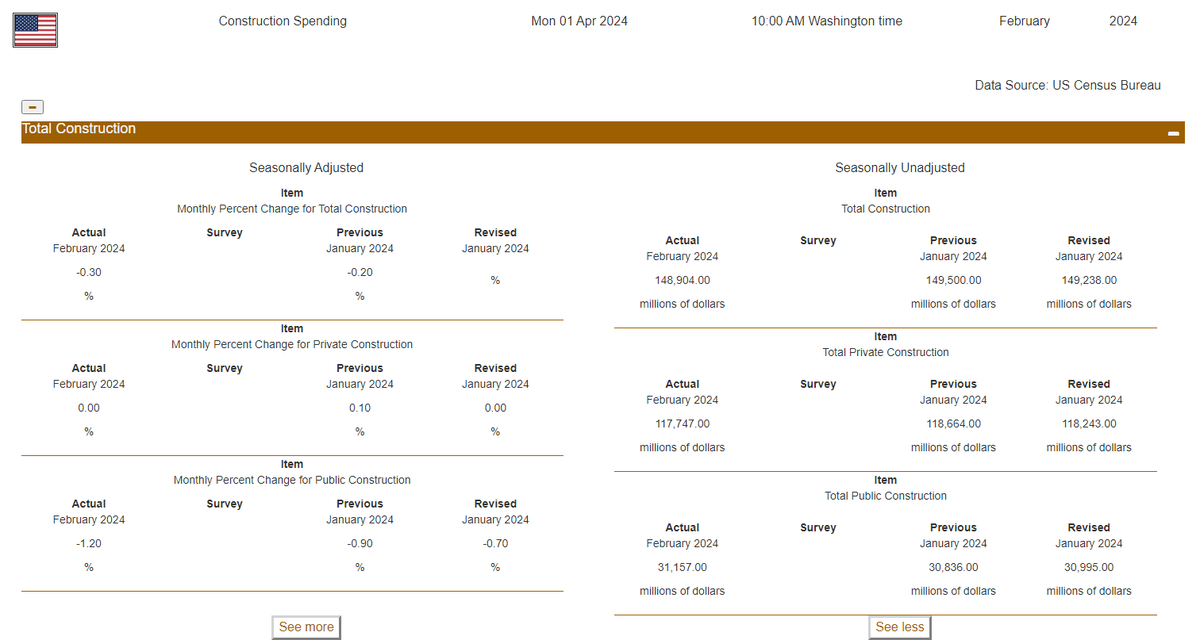
Construction Spending

Total construction activity for Feb24 ($2,091.5B) was 0.3% below the revised Jan24 ($2,096.9B).

February 2024: -0.3* % Change
January 2024 (r): -0.2* % Change

Source: US Bureau

wproconnect.com/economic-calen…

EconData

Construction Spending

Total construction activity for Feb24 ($2,091.5B) was 0.3% below the revised Jan24 ($2,096.9B).

February 2024: -0.3* % Change
January 2024 (r): -0.2* % Change

Source: US #Census Bureau

wproconnect.com/economic-calen…

#CensusEconData #wproconnect
account_circle
WProConnect(@wproconnect) 's Twitter Profile Photo

Construction Spending

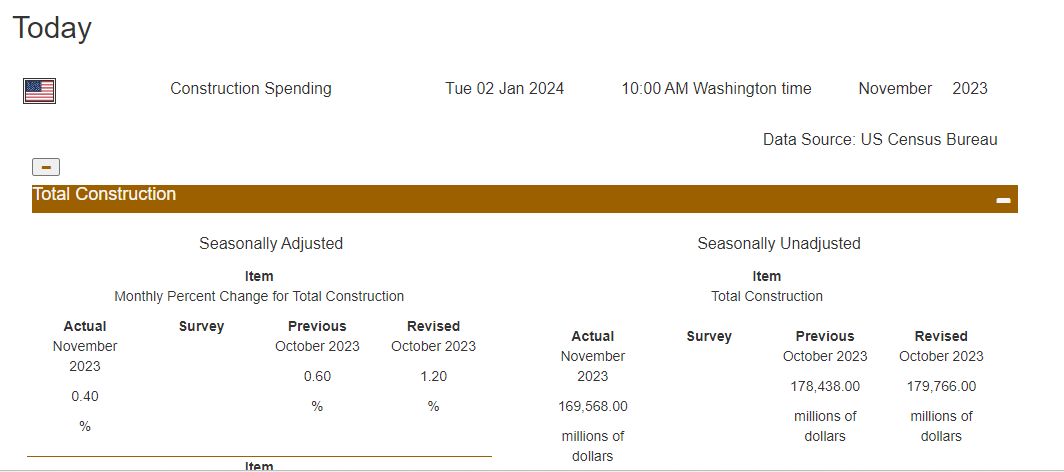
Total construction activity for Nov23 ($2,050.1 billion) was 0.4% above the revised Oct2023 ($2,042.5 billion).

November 2023: +0.4* % Change
October 2023 (r): +1.2* % Change

Source: US Bureau wproconnect.com/economic-calen…

Construction Spending

Total construction activity for Nov23 ($2,050.1 billion) was 0.4% above the revised Oct2023 ($2,042.5 billion).

November 2023: +0.4* % Change
October 2023 (r): +1.2* % Change

Source: US #census Bureau wproconnect.com/economic-calen… 

#CensusEconData #wproconnect
account_circle
U.S. Census Bureau(@uscensusbureau) 's Twitter Profile Photo

Manufactured new orders were up 0.7% to $284.1B (seasonally adjusted) from March to April 2024, up three consecutive months.

Learn more: census.gov/manufacturing/…

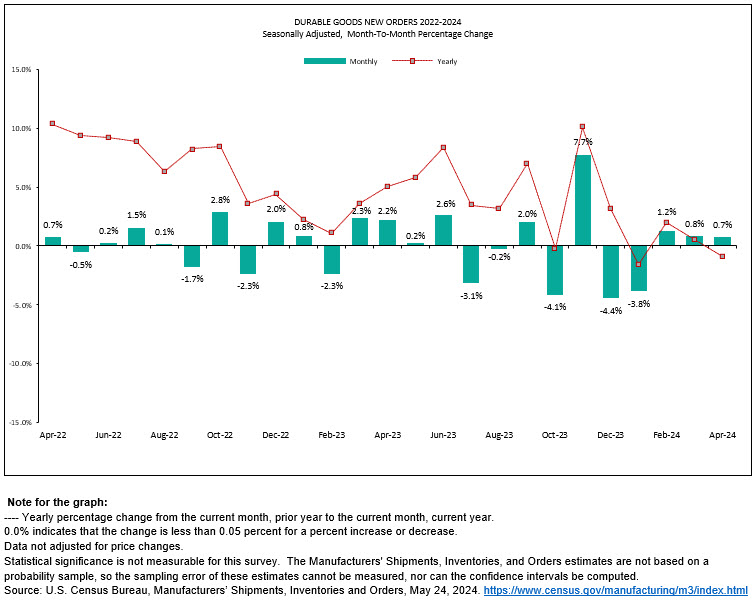
Manufactured #DurableGoods new orders were up 0.7% to $284.1B (seasonally adjusted) from March to April 2024, up three consecutive months.

Learn more: census.gov/manufacturing/… 

#CensusEconData #Manufacturing
account_circle
U.S. Census Bureau(@uscensusbureau) 's Twitter Profile Photo

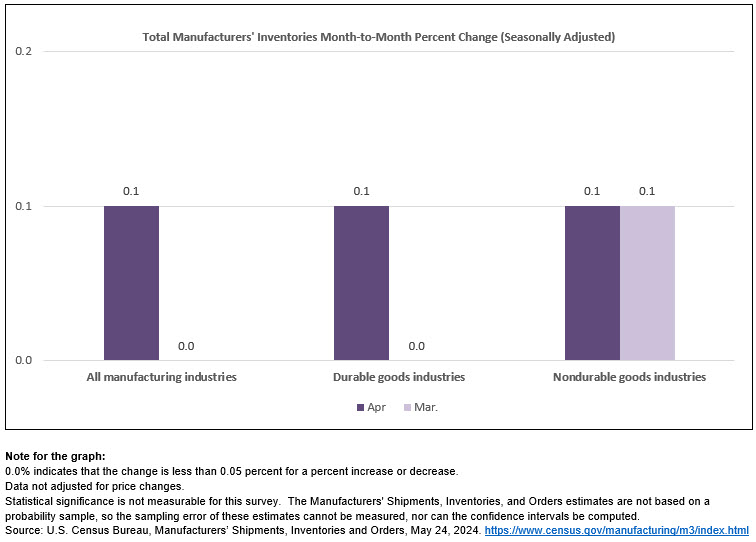
Manufactured inventories were up 0.1% to $858.4B (seasonally adjusted) from March to April 2024, up four of the last five months.

Learn more: census.gov/manufacturing/…

Manufactured #AllIndustries inventories were up 0.1% to $858.4B (seasonally adjusted) from March to April 2024, up four of the last five months.

Learn more: census.gov/manufacturing/…

#CensusEconData #Manufacturing
account_circle
U.S. Census Bureau(@uscensusbureau) 's Twitter Profile Photo

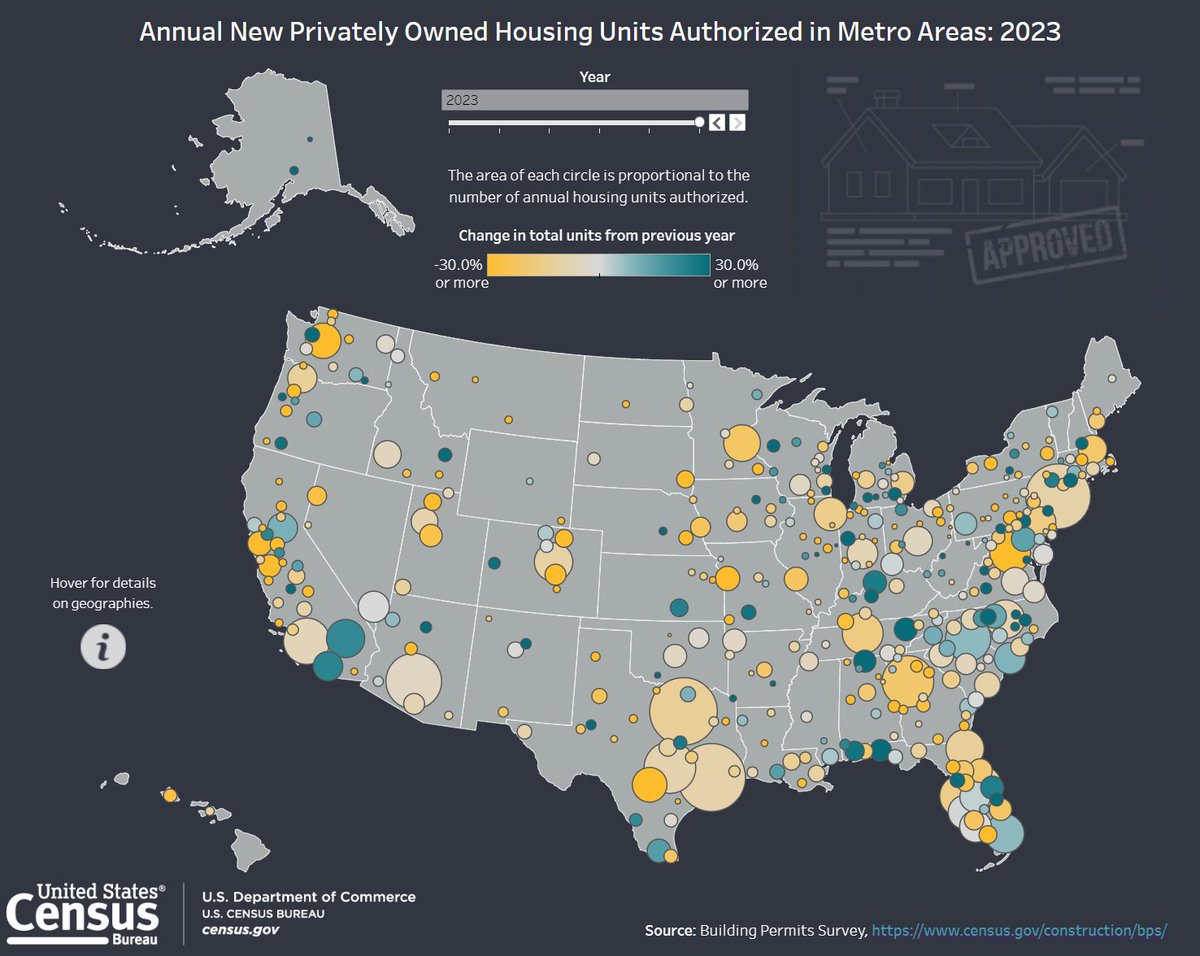
Explore new 2023 annual estimates of housing units authorized by with our interactive maps. 🔎

Select your state or metro area and drill down to the county level.

census.gov/library/visual…

Explore new 2023 annual estimates of housing units authorized by #BuildingPermits with our interactive maps. 🔎

Select your state or metro area and drill down to the county level.

census.gov/library/visual…

#DataViz #CensusEconData
account_circle
U.S. Census Bureau(@uscensusbureau) 's Twitter Profile Photo

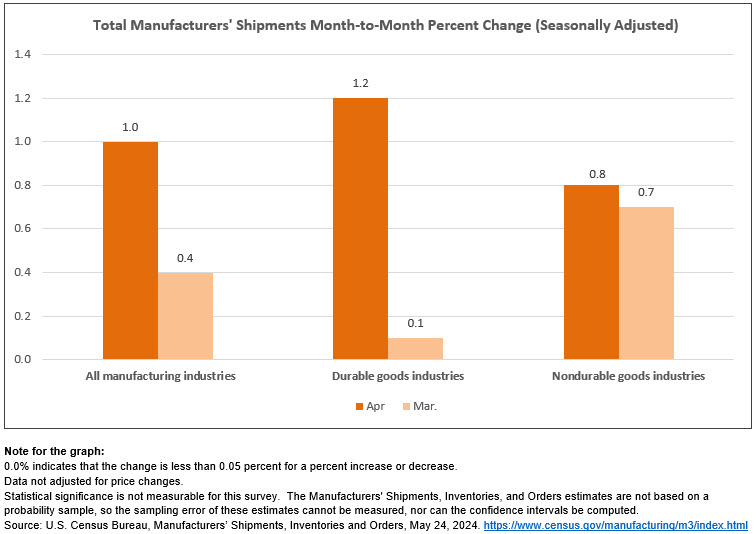
Manufactured shipments were up 1.0% to $590.0B (seasonally adjusted) from March to April 2024, up three consecutive months.

Learn more: census.gov/manufacturing/…

Manufactured #AllIndustries shipments were up 1.0% to $590.0B (seasonally adjusted) from March to April 2024, up three consecutive months.  

Learn more: census.gov/manufacturing/…

#CensusEconData #Manufacturing
account_circle