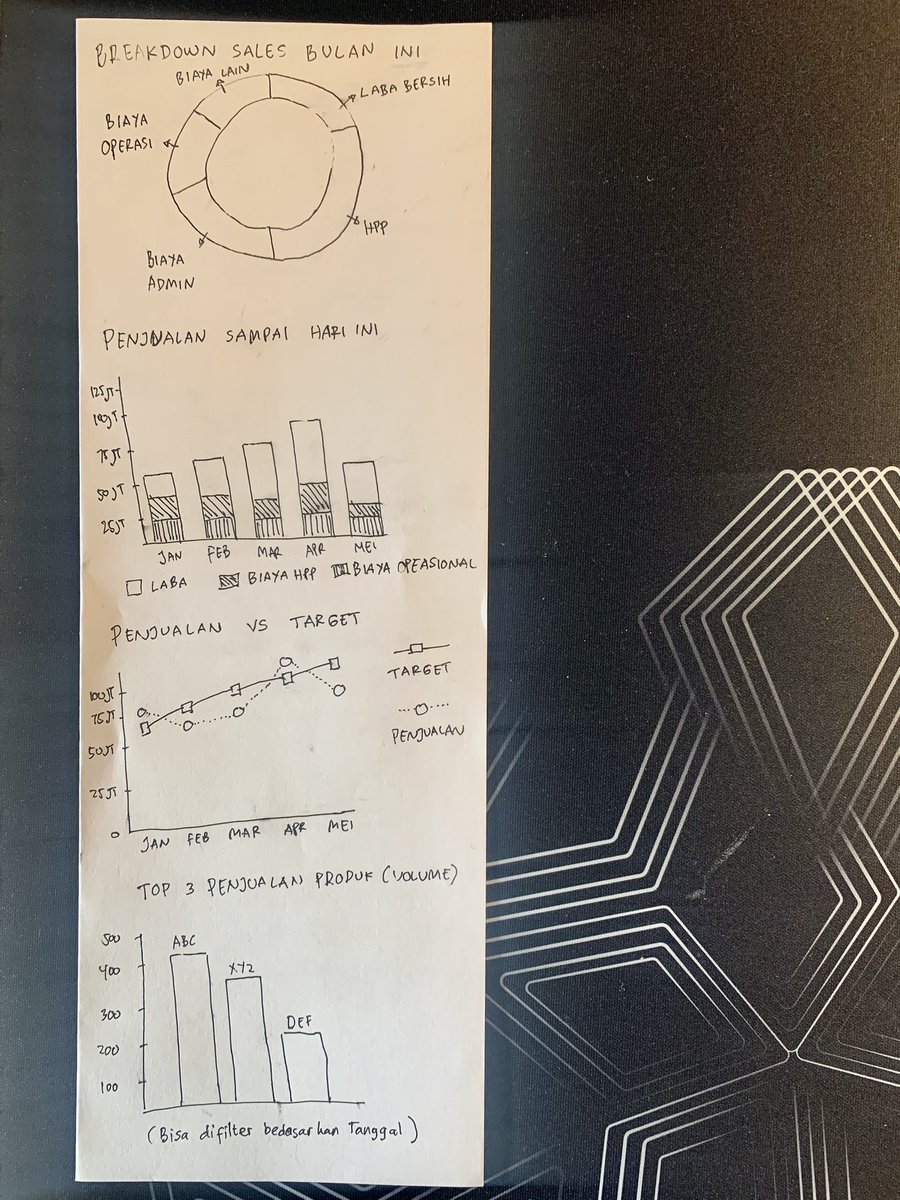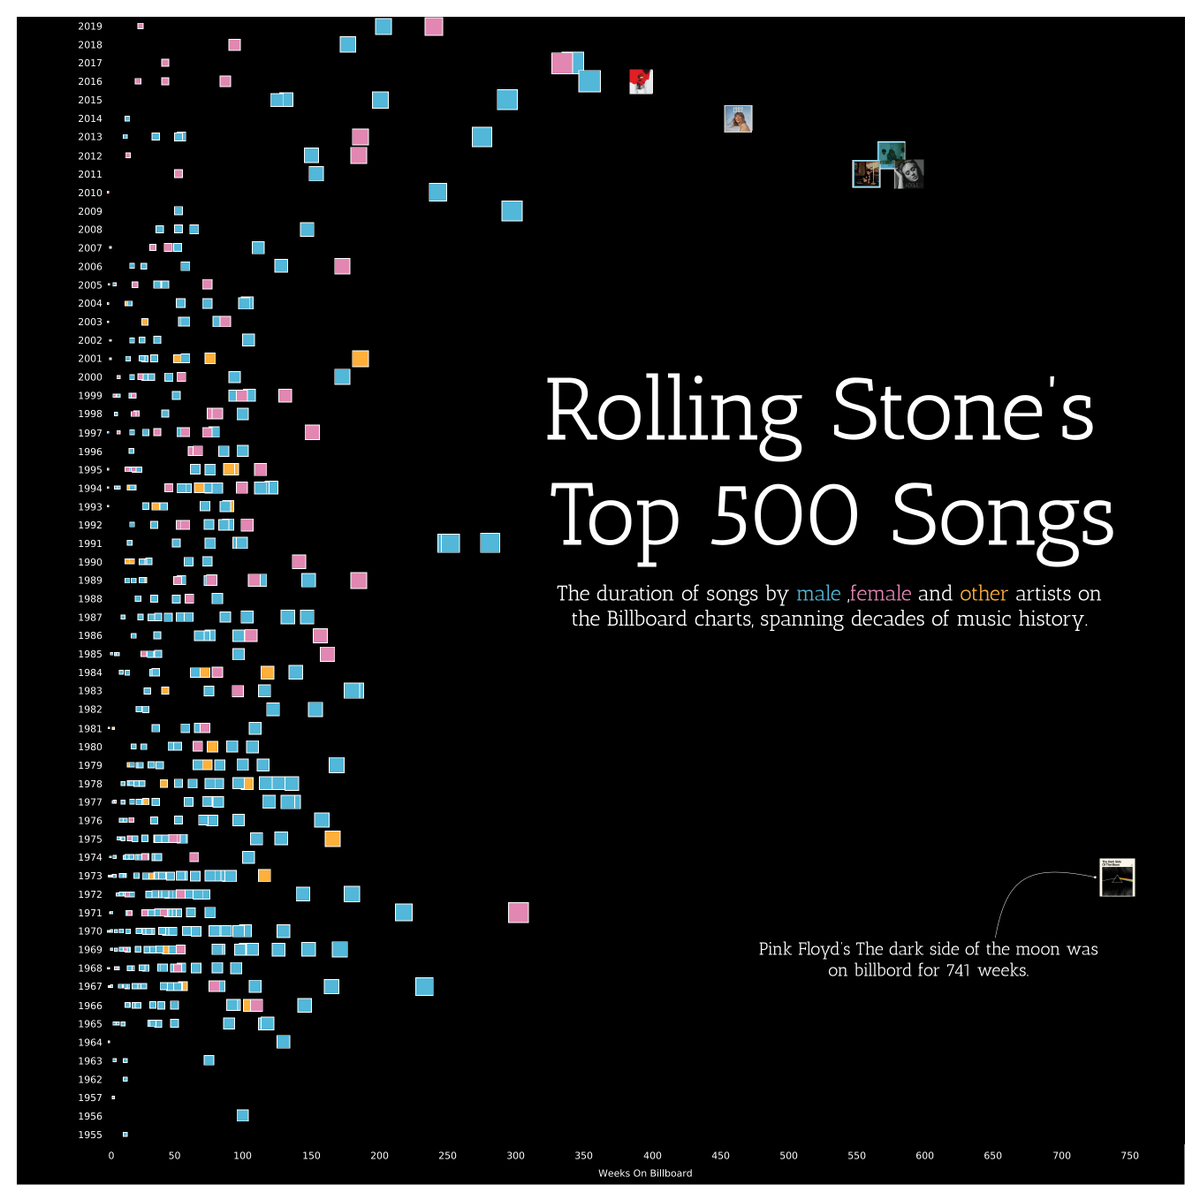


Pasti ga ada yg percaya, 15 tahun lalu saat belum mengenal Power BI atau Tableau, untuk kebutuhan mapping aktifitas Sales saya hanya menggunakan yang satu ini. Baru di thn 2014an mulai pakai sadar My Maps. Dan setelahnya kalian tahu sndiri... #salesdataviz #dataviz #salesmapping


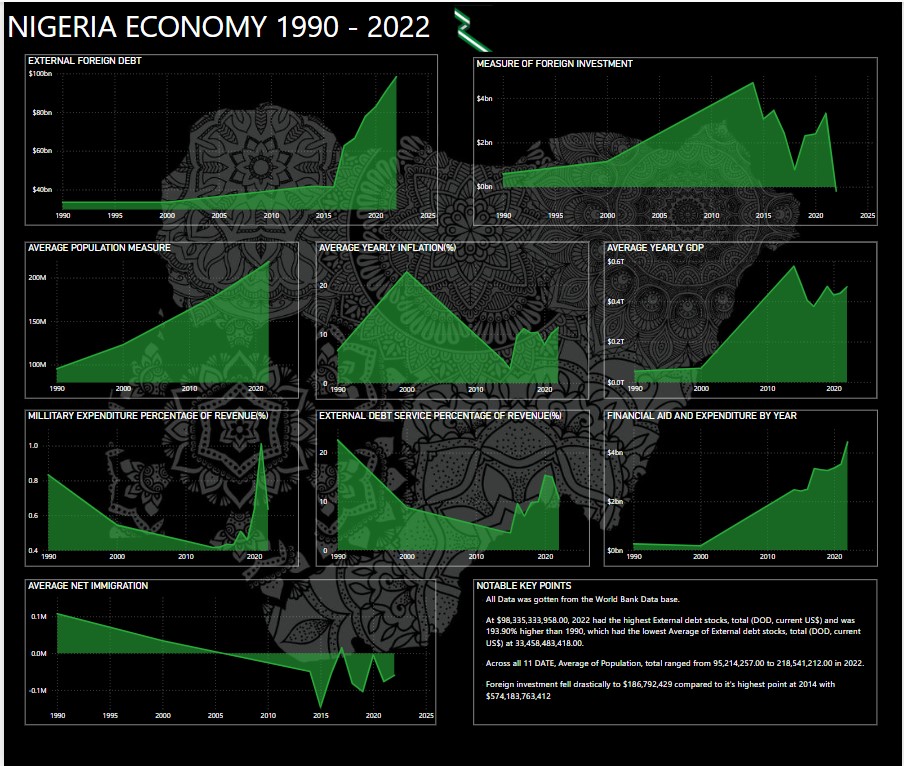
I can't give you the world, but I can give you a beautiful, an interactive and insightful visualizations.
#DataScience #DataAnalytics #DataViz #TechForGood #Datavisualization #Powerbi #MSPowerbi


#Sealevel rise isn't uniform! 🌊 My latest viz of sea level anomalies from 1993-2022 reveals dynamic shifts & regional variations. I followed NASA Technology tutorial to access & visualize 29 years of Sea Surface Height data using #Python . Check it out! #ClimateChange #DataViz


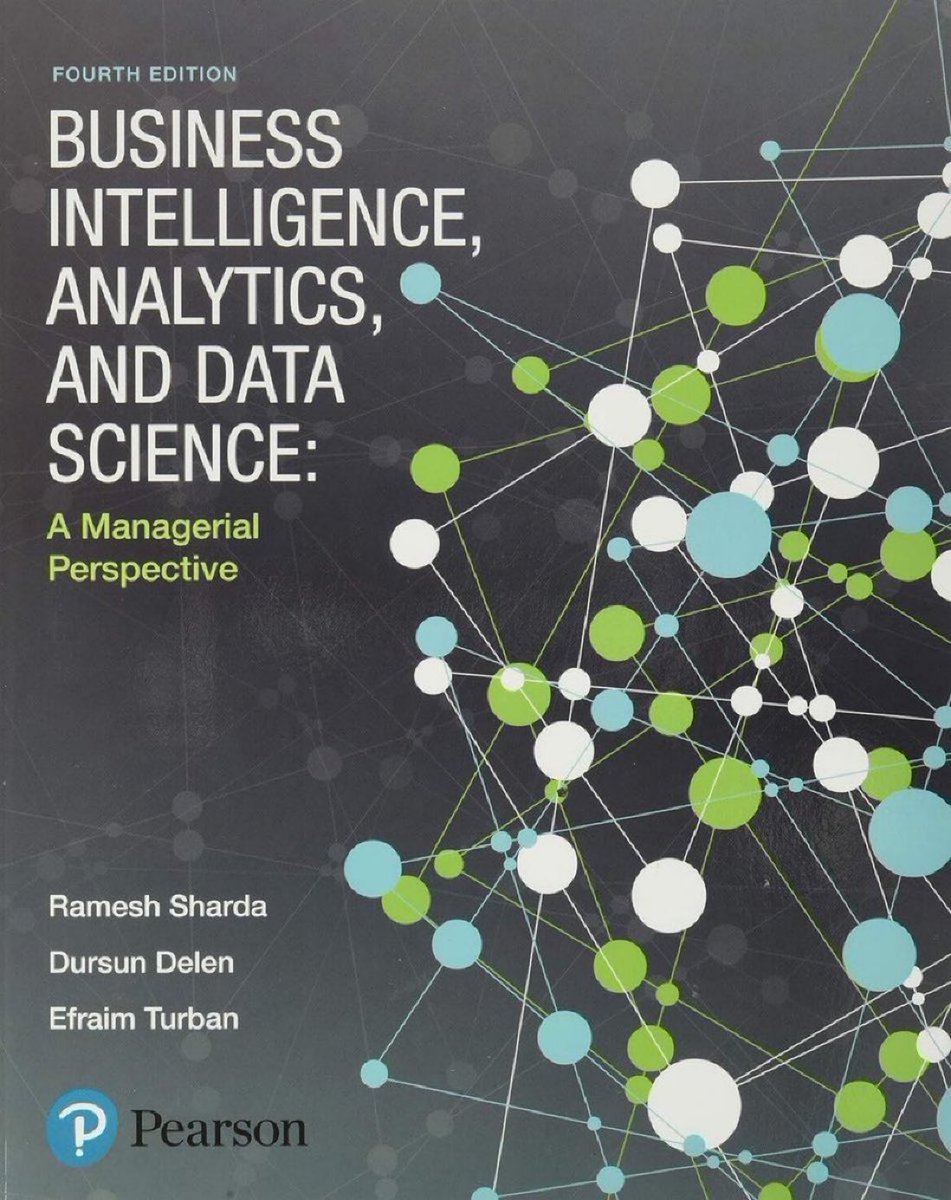
Business Intelligence #BI , #Analytics , and #DataScience — Managerial Perspective (4th Ed.): amzn.to/4744HPj
————
#BigData #DataAnalytics #AI #MachineLearning #DataStrategy #Analytics Strategy #DataViz #VisualAnalytics #PredictiveAnalytics #DecisionScience #AnalyticThinking

🚨Germany is heating up! 🇩🇪🔥My viz between 1951 and 2023 of temperature data reveal a stark warming trend, especially in summer. See the change for yourself. If you are interested check out Milos Makes Maps tutorial😉 #ClimateChange #Germany #DataViz #ERA5 #dataviz #extremeweather


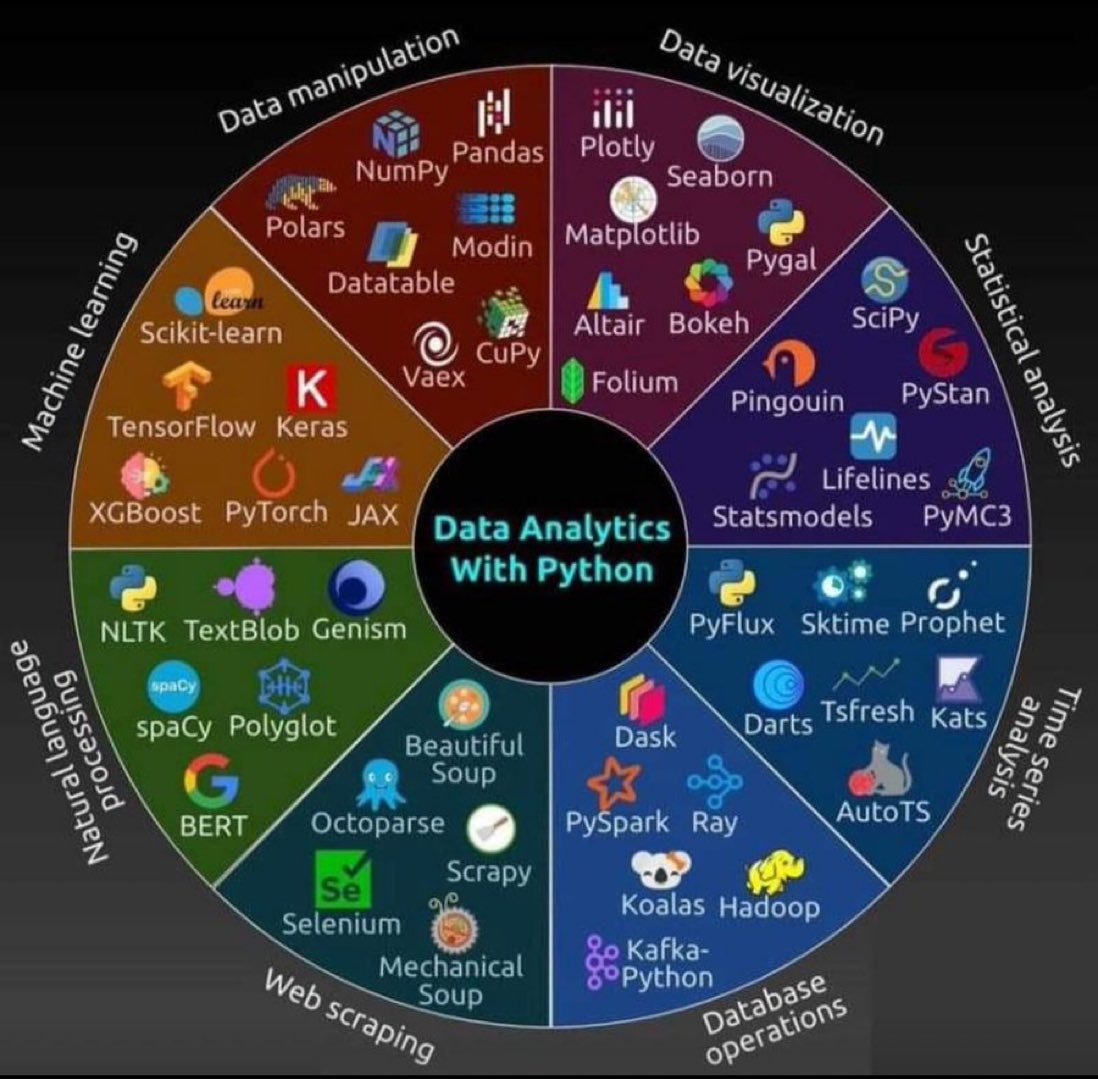
#Python Libraries for different tasks
————
#DataScience #MachineLearning #Analytics #DataScientists #Coding #DataViz #TimeSeries


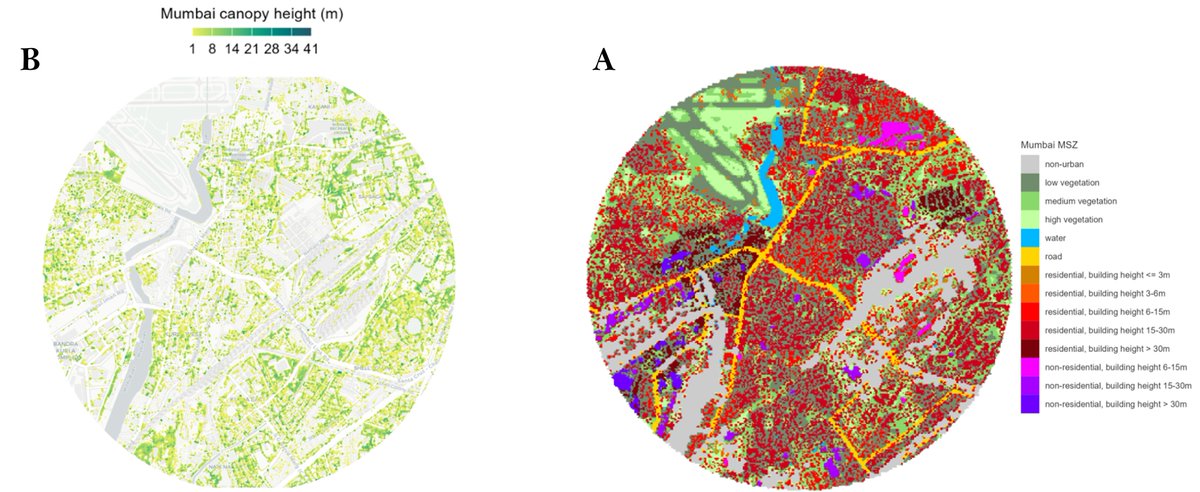
🗣️Who breathes easier in #Mumbai 🇮🇳? 🌳The map link lower canopy cover to denser residential areas, raising concerns about heat islands & air quality. Is green space a privilege? 📢Thanks to Milos Makes Maps tutorial series!
#EnvironmentalJustice #UrbanHeat #ClimateJustice #Dataviz
