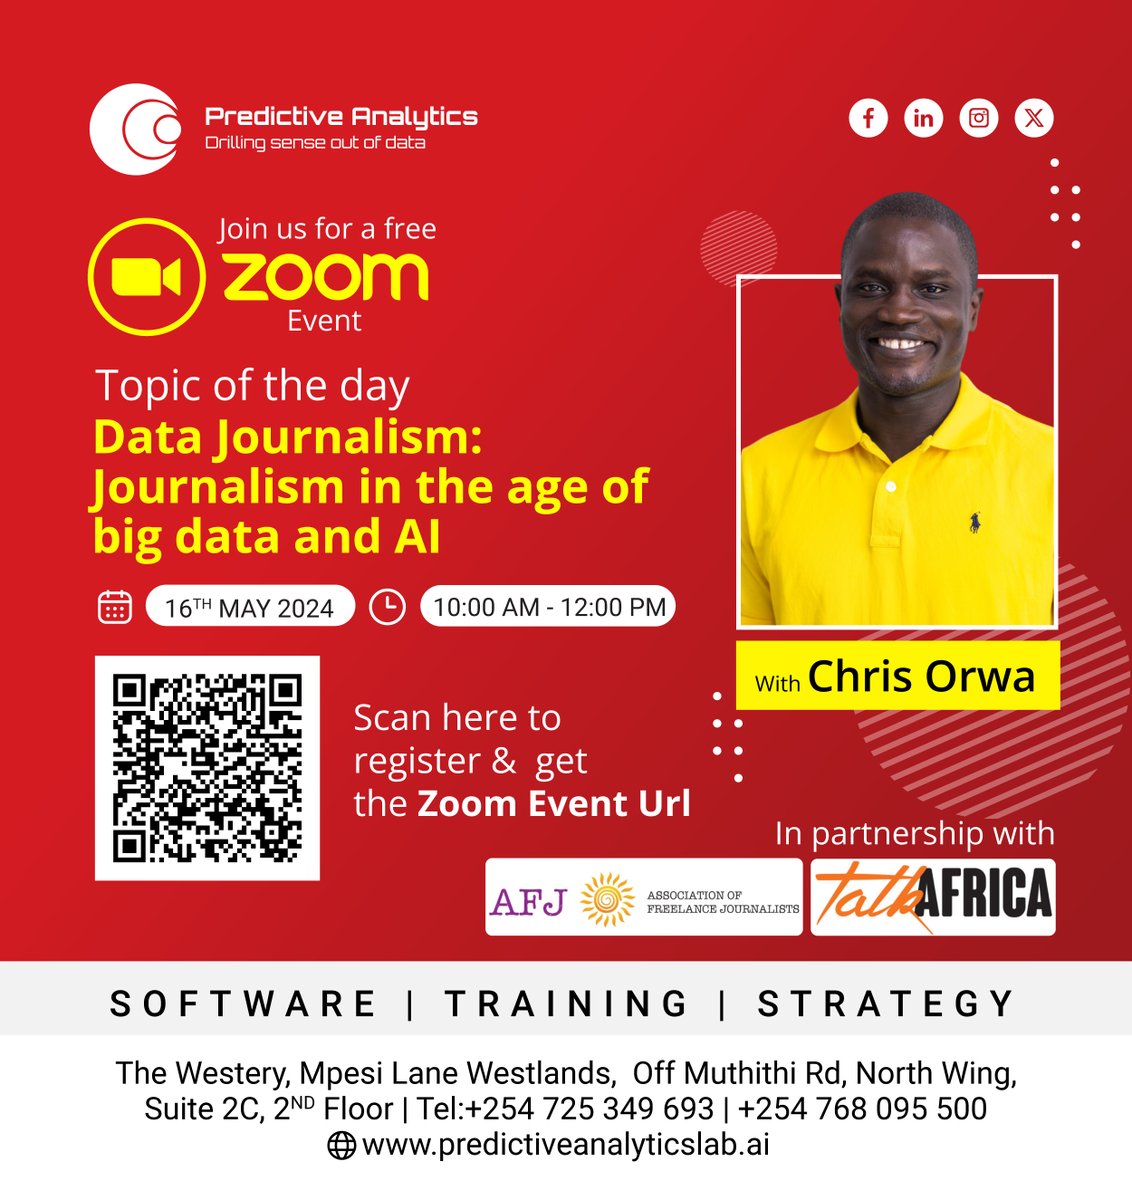
⏰Tomorrow's the big day for our event on 'Data Journalism: Journalism in the Age of Big Data and AI' featuring Chris Orwa. Register now and join us for an eye-opening discussion.
predictiveanalyticslab.ai/event/data-jou…
Zoom link will be shared on registration📈✍️
#DataJournalism

Discover the power of Python in data journalism with our upcoming course led by Ben Welsh, @reuters News Applications Editor! Register now for $95: bit.ly/3weAJvm #Python #JournalismCourses #DataJournalism #ddj
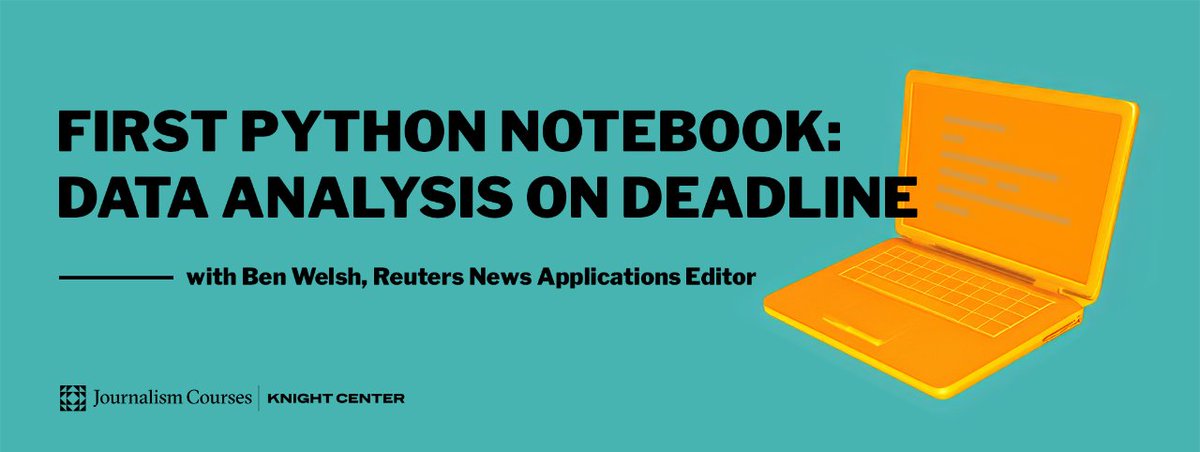

Learn Python with Ben Welsh, @reuters News Applications Editor, in our upcoming course! Limited spots available, register for $95: bit.ly/3weAJvm #DataJournalism #Python #JournalismCourses

Learn Python with Ben Welsh, @reuters News Applications Editor, in our upcoming course! Limited spots available, register for $95: bit.ly/3weAJvm #DataJournalism #Python #JournalismCourses #ddj

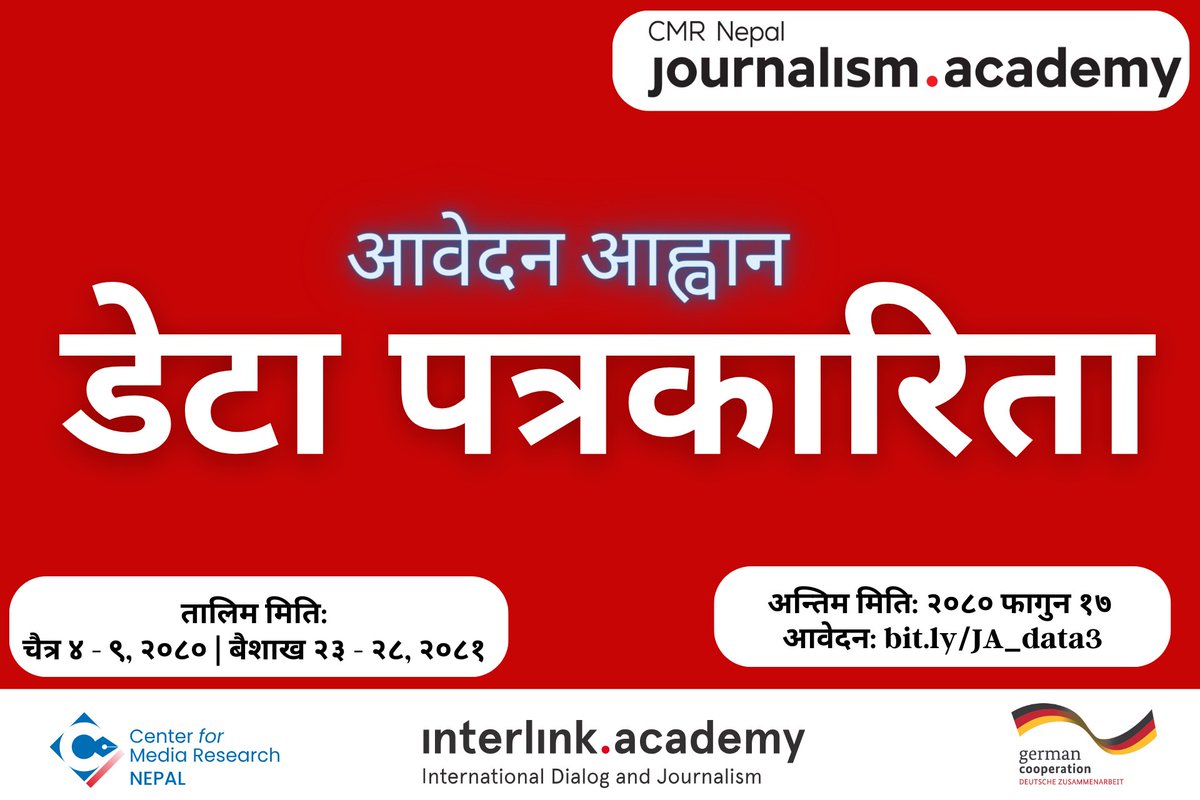
डेटा पत्रकारिता सिक्ने अवसर: CMR-Nepal Journalism Academy ले #DataJournalism तालिमको नयाँ ब्याचको लागि आवेदन आह्वान गरेको छ। छनौट भएका सबैलाई फेलोसिप प्रदान गरिने छ। थप जानकारी: bit.ly/JA_data3

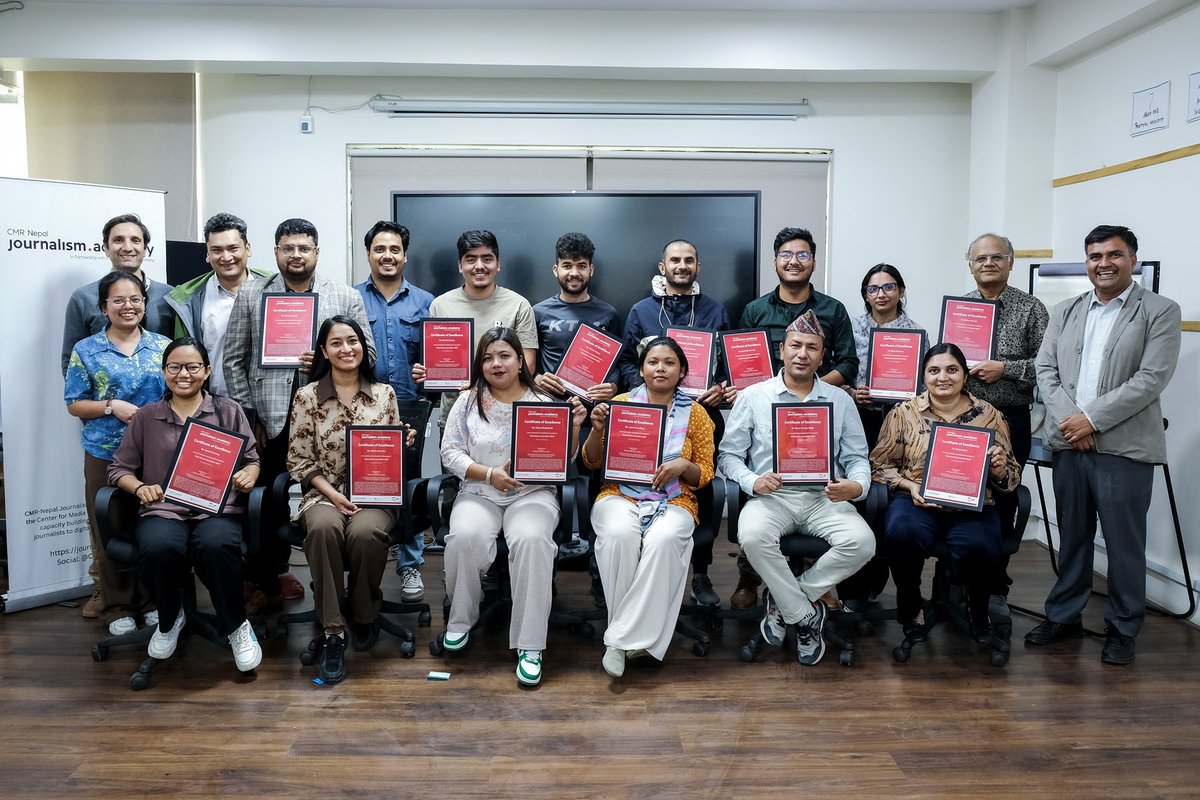
#Congratulations to our 3rd batch of data journalists! 13 journalists of Nepal completed our #DataJournalism course today. w/ Interlink Academy Center for Media Research - Nepal
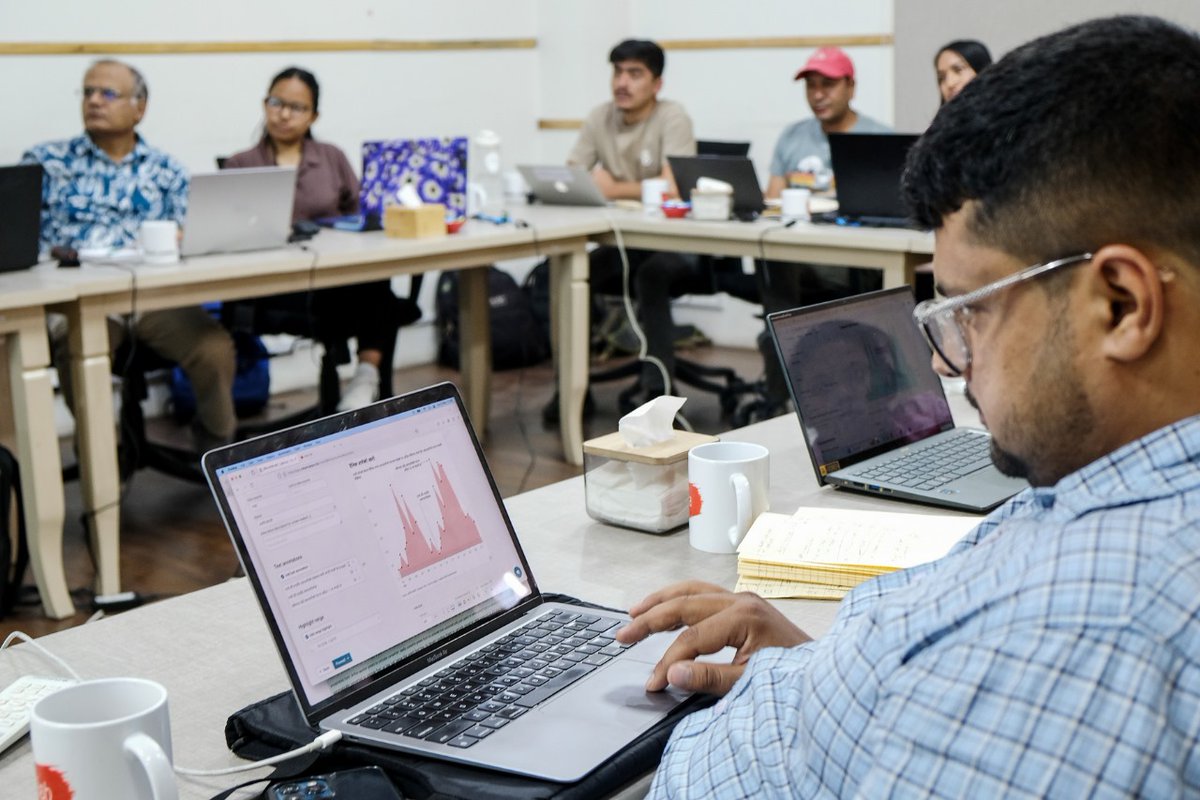

डेटा आधारित पत्रकारिता #datajournalism को Center for Media Research - Nepal बाट दुईमहिने तालिम पाउनेहरू ६२ जना पुग्नुभएको छ। प्रशिक्षार्थी र प्रशिक्षकहरूसँग म उभिएको यो तस्बिर चाहिँ पाँचौ (@CMR_Academy को चाहिँ तेस्रो) ब्याचको हो । कसैलाई चिन्नु हुन्छ कि?


Dernier récit cartographique réalisé pour Splann ! Lanceur d'enquêtes en illustration d'une enquête de Nolwenn Weiler et Yann-Malo Kerbrat sur la fragilité du bocage breton splann.org/enquete/bocage/ #cartes #agriculture #environnement #datajournalism

📬 Do you want to stay up-to-date with the latest EDJNet investigations? 🔍 Subscribe to our #newsletter , where you'll also find fellowship opportunities, grants, and more from the European #datajournalism community!
📝👉 …andatajournalism.us16.list-manage.com/subscribe?u=f6…

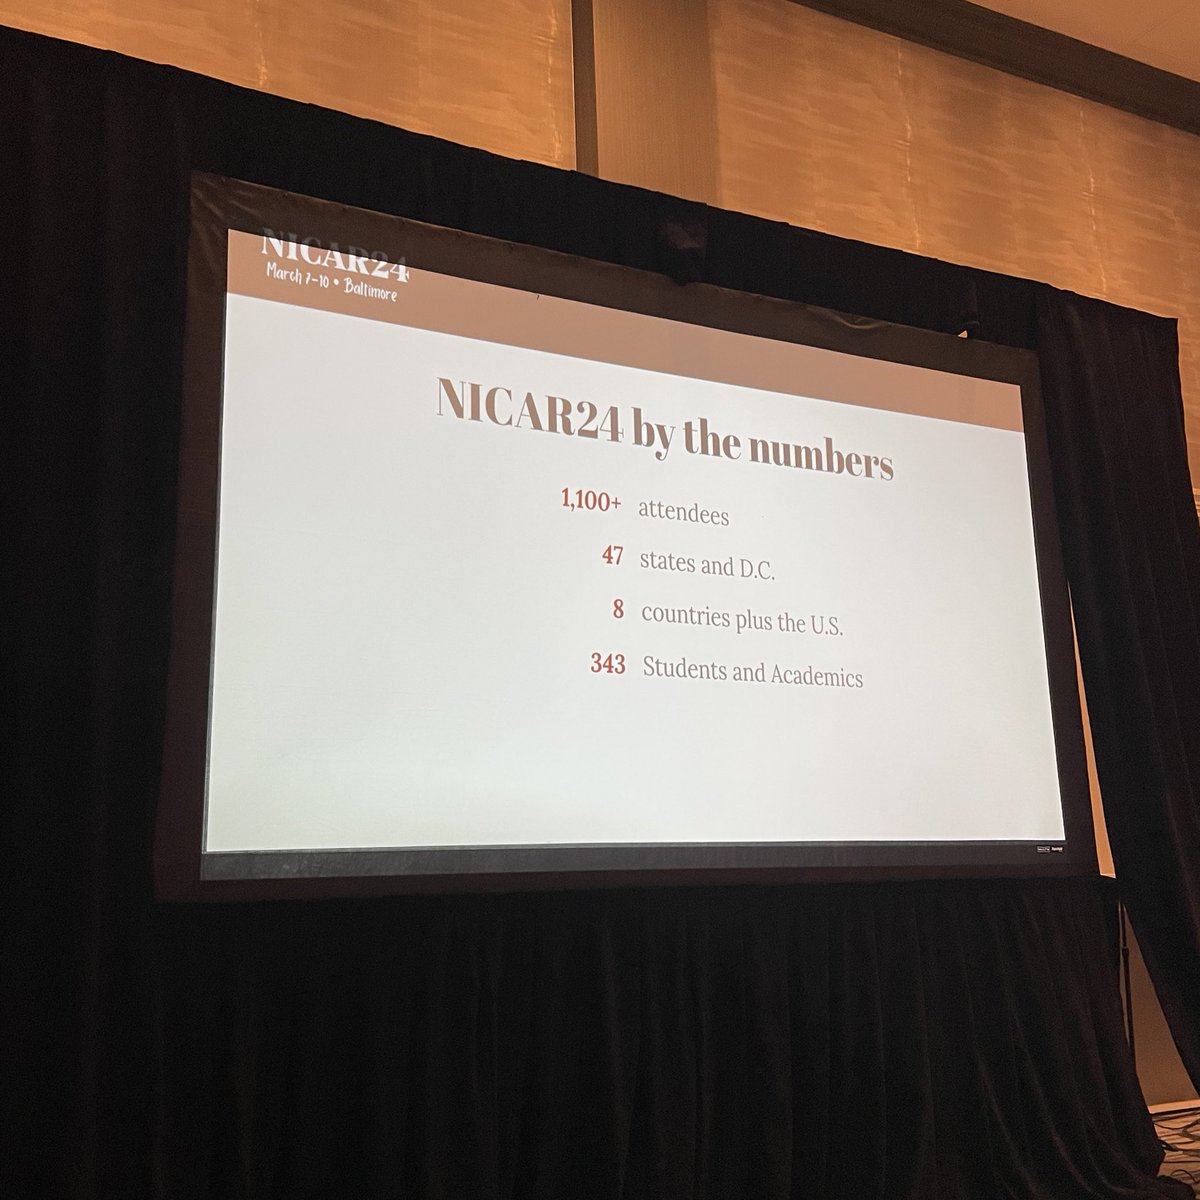
#NICAR24 left me speechless. I feel inspired and empowered to keep growing as a data journalist and investigative reporter. The knowledge I gained from these sessions is invaluable. Thank you UF College of Journalism and Communications for this opportunity. The Fourth Estate is alive and well. #datajournalism

Learn Python with Ben Welsh, @reuters News Applications Editor, in our upcoming course! Limited spots available, register for $95: bit.ly/3weAJvm #DataJournalism #Python #JournalismCourses #ddj

Learn Python with Ben Welsh, @reuters News Applications Editor, in our upcoming course! Limited spots available, register for $95: bit.ly/3weAJvm #DataJournalism #Python #JournalismCourses #ddj

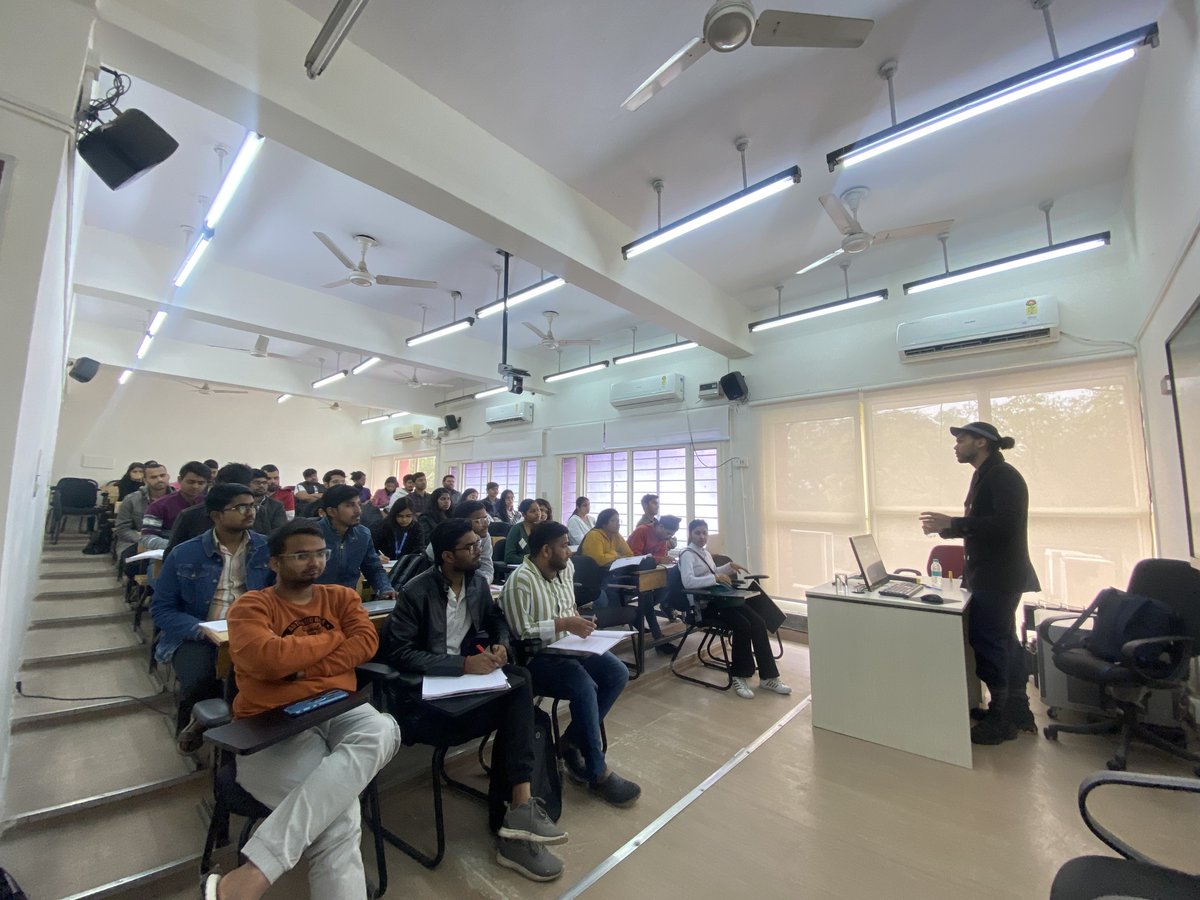
Department of English Journalism organized a full day workshop on #DataJournalism by Prof. Umesh Arya and Shri Kanishk Karan on 13th Feb.
Prof (Dr.) Surbhi Dahiya [email protected]

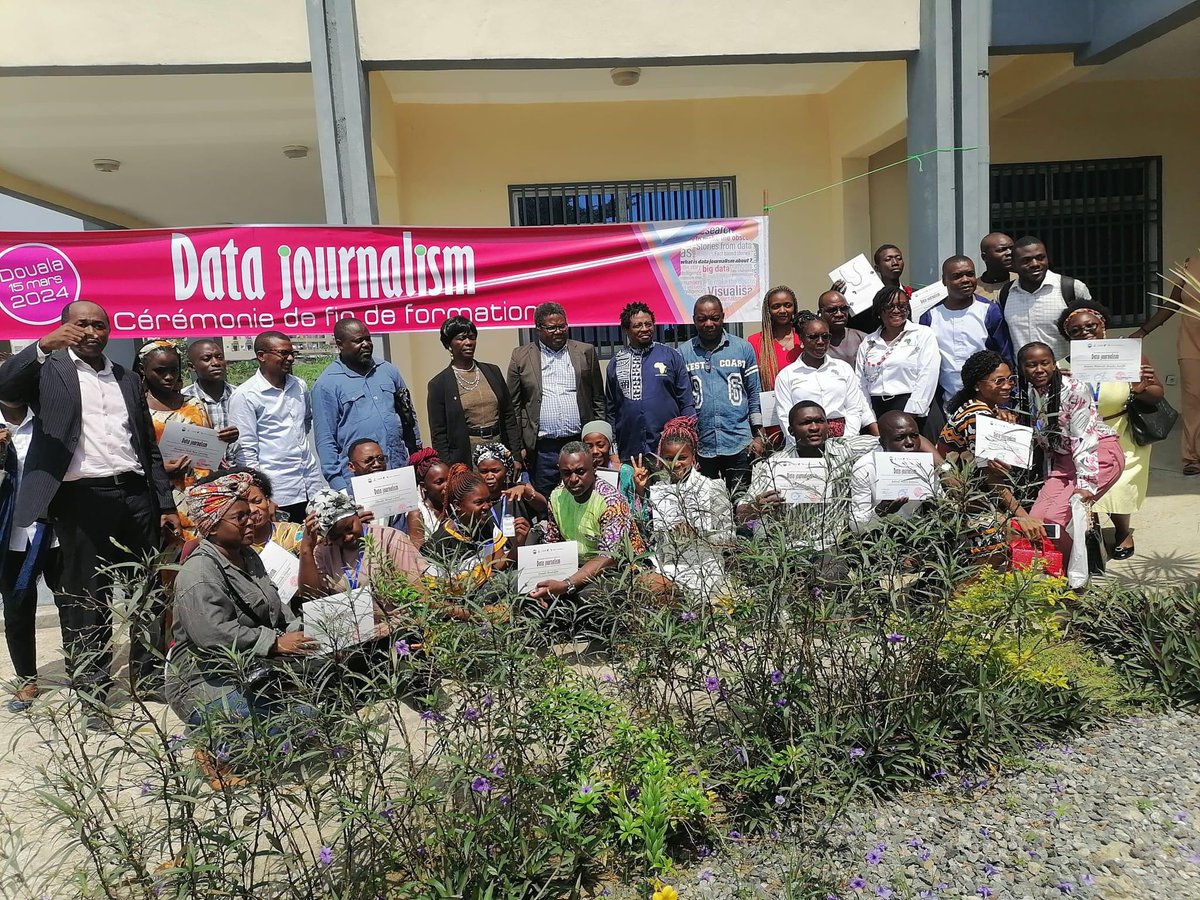
Les premiers certificats en #DataJournalism de l’université de #Douala . ADISI-Cameroun est très heureuse d’avoir assuré la partie technique de ce projet, premier du genre en Afrique centrale.

Learn Python with Ben Welsh, @reuters News Applications Editor, in our upcoming course! Limited spots available, register for $95: bit.ly/3weAJvm #DataJournalism #Python #JournalismCourses #ddj


