Grafana(@grafana) 's Twitter Profileg
Grafana

@grafana

#GrafanaCON 2024 talks are now available on our YouTube channel. Click the link to start streaming.

ID:2439889542

linkhttps://www.youtube.com/playlist?list=PLDGkOdUX1UjoS7_KFt1YJnppyDEQGEISE calendar_today12-04-2014 11:32:09

5,2K Tweets

59,3K Followers

137 Following

Follow People
Grafana(@grafana) 's Twitter Profile Photo

☁️ There are four ways to monitor your AWS metrics in Grafana. Find out which one best fits your needs with this handy guide. bit.ly/4avx3U2

account_circle
Grafana(@grafana) 's Twitter Profile Photo

🆕 Heck. Yes. Grafana Beyla is now available in Grafana Alloy as the default -based application auto-instrumentation solution.

With this, Alloy users can automatically capture metrics and traces of running services and connect to their existing telemetry pipelines. Grafana

🆕 Heck. Yes. Grafana Beyla is now available in Grafana Alloy as the default #eBPF-based application auto-instrumentation solution. With this, Alloy users can automatically capture metrics and traces of running services and connect to their existing telemetry pipelines. Grafana
account_circle
Grafana(@grafana) 's Twitter Profile Photo

To illustrate how you can adapt OnCall and tie it to your existing environment, let’s set up alert group notifications and updates to other messaging solutions like and . bit.ly/3wTHv9Q

account_circle
Grafana(@grafana) 's Twitter Profile Photo

🍎 is happening in NYC Sep. 24-25, and our is open!

We're looking for observability experts who want to share their strategies & architectures — including projects using the LGTM Stack, , & more!

Submit by June 10: grafana-labs.typeform.com/to/vu8bTIgT?sr…
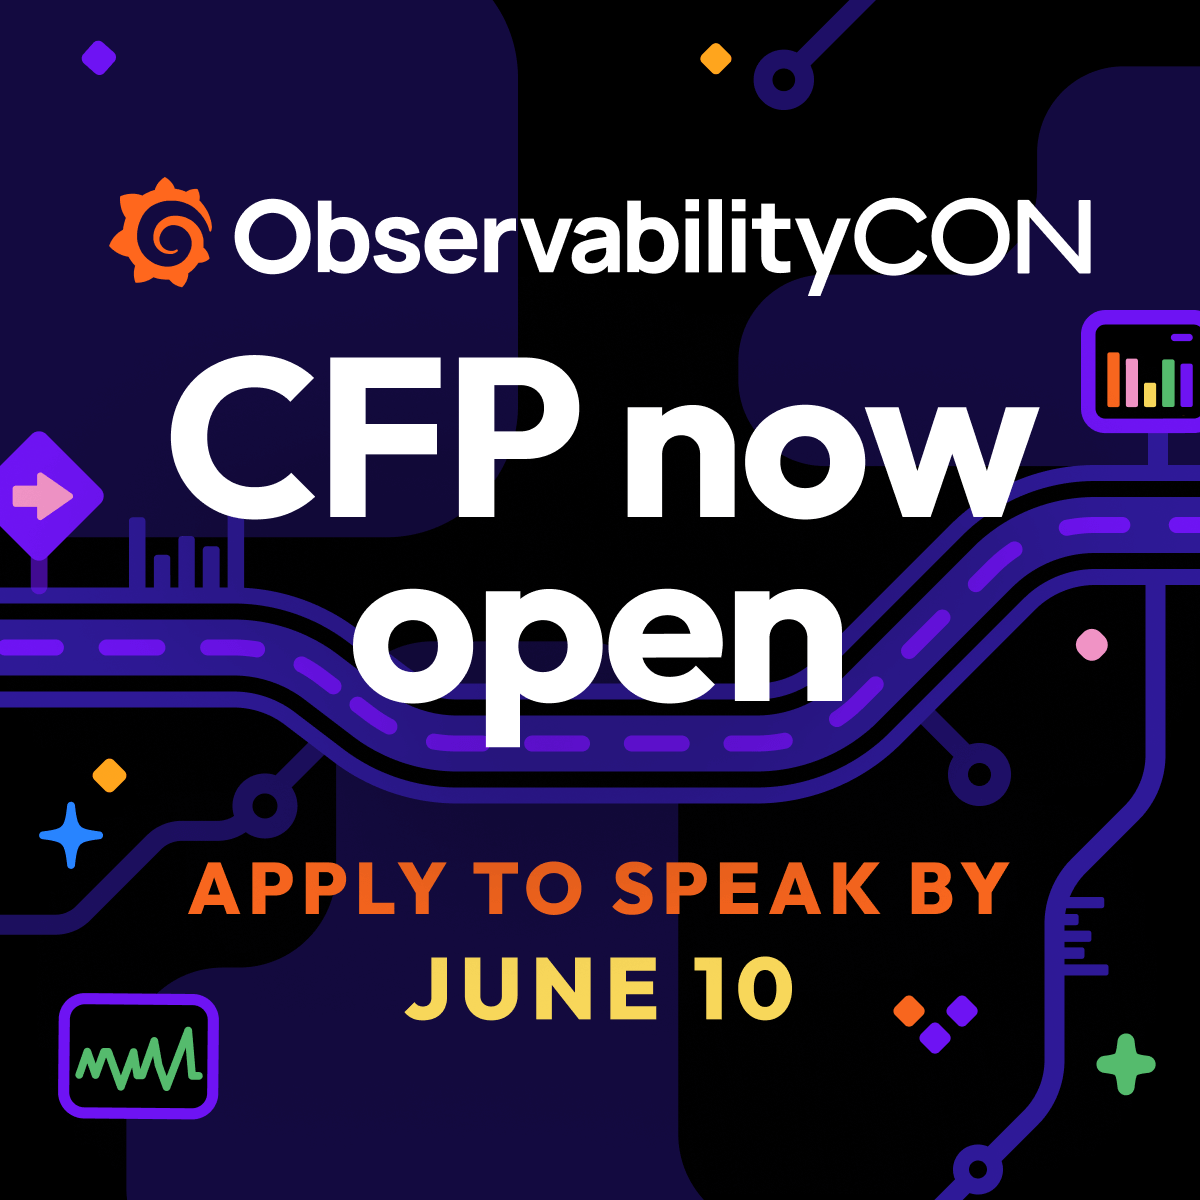
🍎 #ObservabilityCON is happening in NYC Sep. 24-25, and our #CFP is open! We're looking for observability experts who want to share their strategies & architectures — including projects using the LGTM Stack, #OTel, #Prometheus & more! Submit by June 10: grafana-labs.typeform.com/to/vu8bTIgT?sr…
account_circle
Grafana(@grafana) 's Twitter Profile Photo

🕯️ The candlestick visualization allows you to visualize data that includes a number of consistent dimensions focused on price movements, such as stock prices.

Check out Marie Cruz 🇵🇭's video on how to configure a candlestick visualization: youtu.be/IOFKBgbf3aM
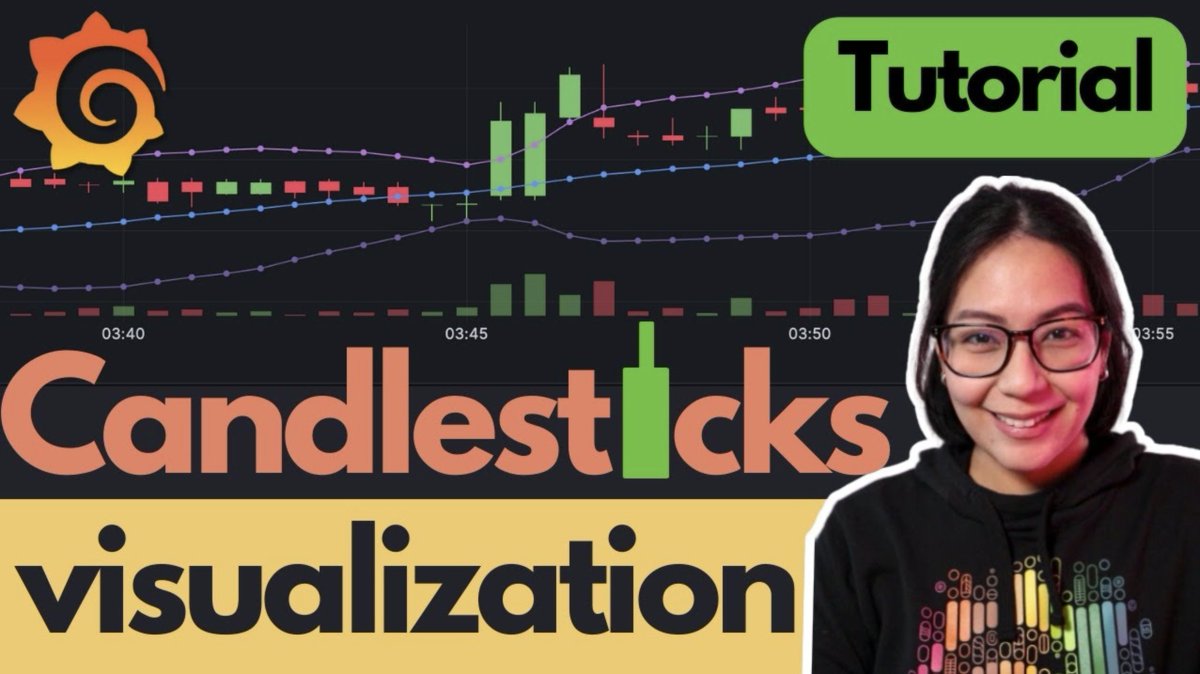
🕯️ The candlestick visualization allows you to visualize data that includes a number of consistent dimensions focused on price movements, such as stock prices. Check out @mcruzdrake's video on how to configure a candlestick visualization: youtu.be/IOFKBgbf3aM
account_circle
Grafana(@grafana) 's Twitter Profile Photo

If you're heading to WeTest.Athens, don't miss 'Mastering Performance Testing with Grafana' led by Champion Ioannis Papadakis, Director of QA at GWI.

You'll learn how to improve application resiliency with chaos testing using Grafana k6.

wetest-athens.gr/ioannis-papada…

account_circle
Grafana(@grafana) 's Twitter Profile Photo

🥵 Let's add some heat to those dashboards. Hello, heatmaps!

Marie Cruz 🇵🇭 discusses the difference between heatmaps vs. histograms and how to configure them: youtu.be/SGWBzQ54koE
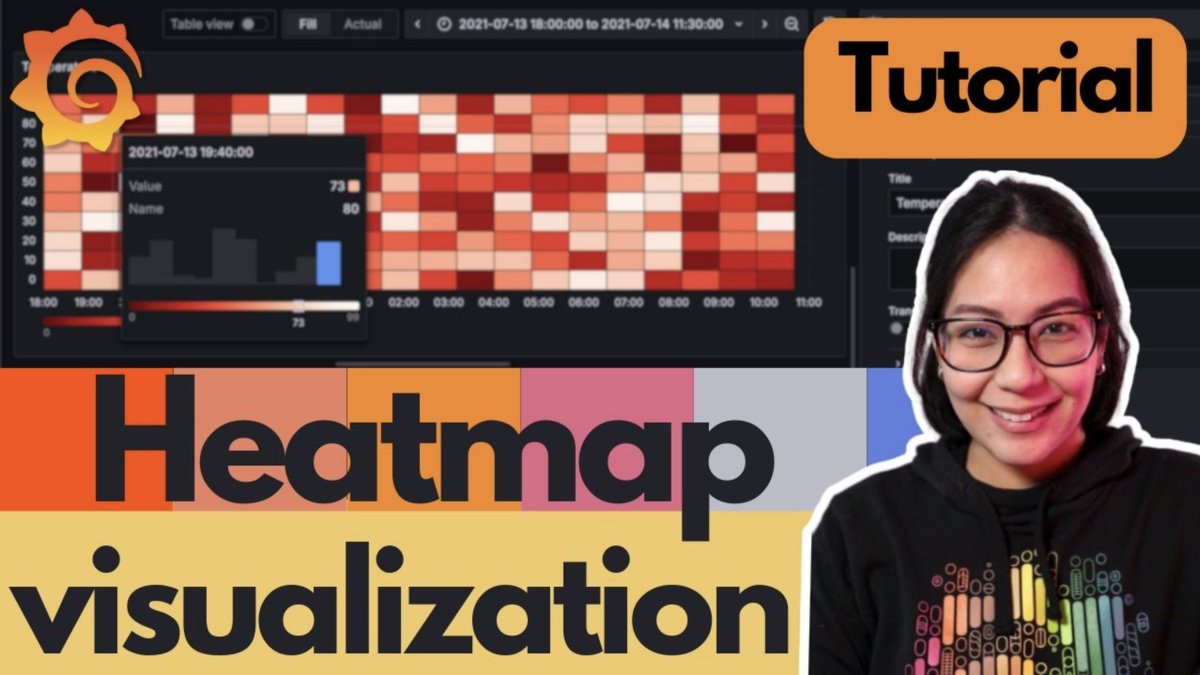
🥵 Let's add some heat to those dashboards. Hello, heatmaps! @mcruzdrake discusses the difference between heatmaps vs. histograms and how to configure them: youtu.be/SGWBzQ54koE
account_circle
Grafana(@grafana) 's Twitter Profile Photo

According to Richard "RichiH" Hartmann @[email protected], there are two fundamental ways to efficient cloud usage:

1️⃣ 'Go all-in on bespoke services, leveraging whatever you can to reduce undifferentiated heavy lifting and focus on solving problems that drive your business forward.”

2️⃣ 'Use as few bespoke

According to @TwitchiH, there are two fundamental ways to efficient cloud usage: 1️⃣ 'Go all-in on bespoke services, leveraging whatever you can to reduce undifferentiated heavy lifting and focus on solving problems that drive your business forward.” 2️⃣ 'Use as few bespoke
account_circle
Grafana(@grafana) 's Twitter Profile Photo

👩‍🍳 Add some pièce de résistance to your dashboards!

Our webinar on May 22 is *chefs kiss* — you'll learn how to maximize your dashboard's full potential with advanced techniques.

bit.ly/3yuoqvC

account_circle
Grafana(@grafana) 's Twitter Profile Photo

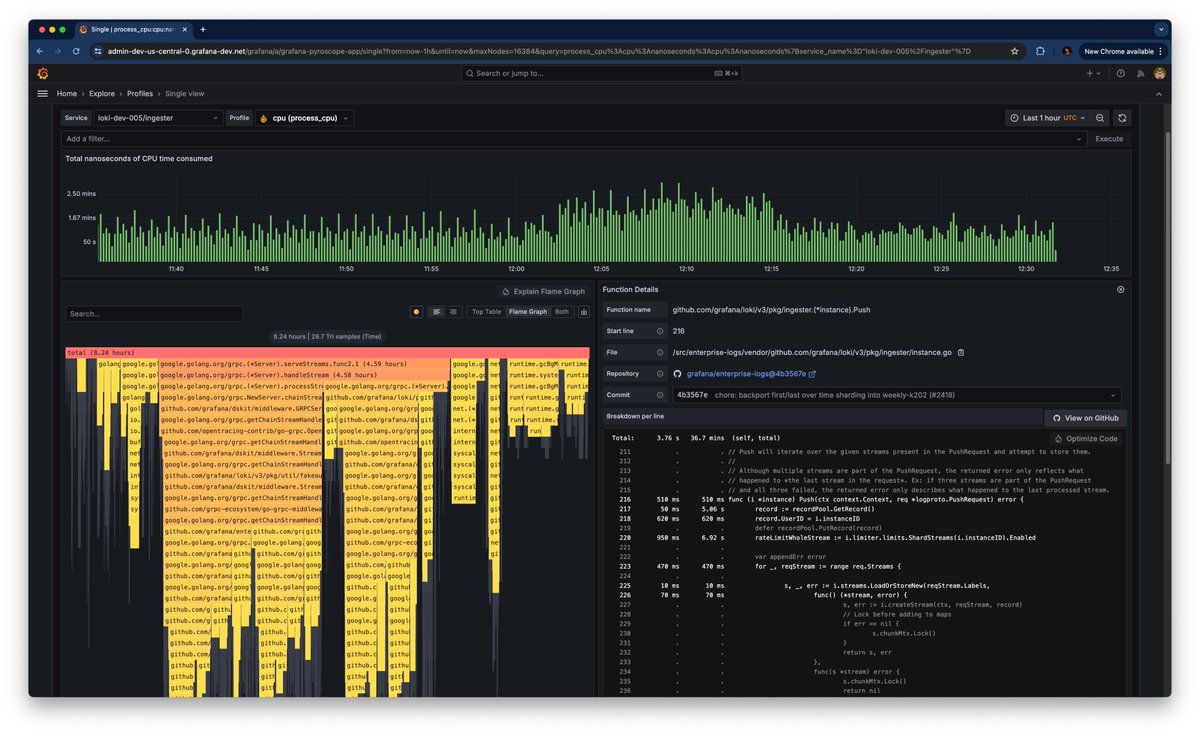
Flame graph analysis shouldn't be complicated. That's why we're introducing Flame graph AI in Cloud!

Flame graph AI uses to assist with flame graph data interpretation so you can identify bottlenecks, root causes & suggested fixes faster. bit.ly/44N4zns

Flame graph analysis shouldn't be complicated. That's why we're introducing Flame graph AI in #Grafana Cloud! Flame graph AI uses #LLMs to assist with flame graph data interpretation so you can identify bottlenecks, root causes & suggested fixes faster. bit.ly/44N4zns
account_circle
Grafana(@grafana) 's Twitter Profile Photo

🏃 This video's for the operators.

Sprint (don't walk) to Grafana 11!

You'll love the new features — including the highly requested subfolders, Team LBAC (for Loki), and authentication!

account_circle
Grafana(@grafana) 's Twitter Profile Photo

🛣️ Everyone's journey is unique, but do you know where your organization stands?

Take our free assessment to find out and we'll provide guidance on how to improve your observability maturity.

bit.ly/3UNljq3

account_circle
Grafana(@grafana) 's Twitter Profile Photo

' capabilities will be extended to accommodate applications such as storage, multiple API management and extending its observability capabilities to offer event-driven functionalities, management & other capabilities.'

Say hello to the Grafana App Platform!

account_circle
Grafana(@grafana) 's Twitter Profile Photo

📰 It's *not* fake news — Grafana 11 is now generally available!

Watch this video from Jay Clifford to see the features that users can take advantage of in this new release.

account_circle