Robert Rouse(@bibleviz) 's Twitter Profileg
Robert Rouse

@bibleviz

Minister of Data at https://t.co/bBLIKB0DV4 and craftsman of data visualization. DMs are open.

ID:87021748

linkhttps://viz.bible calendar_today02-11-2009 20:35:35

367 Tweets

2,7K Followers

707 Following

Robert Rouse(@bibleviz) 's Twitter Profile Photo

I don't want to help me make a new dashboard. That's already the easiest part of my job. I want it to be my research assistant to collect and summarize data across my entire library. We need to focus on the engine room more than the interface.

account_circle
Robert Rouse(@bibleviz) 's Twitter Profile Photo

It's been a few years, but I still remember the beauty and intricacy of the stuff at timeplots.com. I have seen no better visual representation of the history of American government than these posters from Graphicacy. Check it out--some of this may be new to you.

account_circle
Action Analytics(@theactionauts) 's Twitter Profile Photo

Actionaut Robert Rouse has revamped the conf nametag. See if you can spot an Action nametag t-shirt at or . Networking just got a lot cooler. action.co/innovating-con…

account_circle
Robert Rouse(@bibleviz) 's Twitter Profile Photo

At today, Jana Eggers said AI is doing the fun stuff like art and writing. She suggested that AI ought to be doing the boring stuff like file cleanup. I agree!

account_circle
Alistair Croll(@acroll) 's Twitter Profile Photo

Over the last year, a number of CIO/CDO friends have asked for a reasoned, less breathless take on generative AI and how it'll upend enterprise IT.

I've concluded that we're building a second stack. I wrote up my thoughts here.

datauniverseevent.com/en-us/blog/gen…

account_circle
RJ Andrews(@infowetrust) 's Twitter Profile Photo

“AND ALL THAT YOU SEE … AND ALL THAT YOU GIVE … AND ALL YOU CREATE ….”

We just opened Kenneth Field ‘s TOTAL ECLIPSE and I’m blown away. every sun gold foil. This must be the most spectacular print information graphic since a long time. Hard to convey via screen!

“AND ALL THAT YOU SEE … AND ALL THAT YOU GIVE … AND ALL YOU CREATE ….” We just opened @kennethfield ‘s TOTAL ECLIPSE and I’m blown away. every sun gold foil. This must be the most spectacular print information graphic since a long time. Hard to convey via screen!
account_circle
Robert Rouse(@bibleviz) 's Twitter Profile Photo

As I describe ideas around interactions with dashboards or applications, I strive to use the term 'people' more than 'users.' I think that encourages us to think more about human beings and less about knowledge-factory workers. What do you think? Is that too pedantic?

account_circle
Austen Allred(@Austen) 's Twitter Profile Photo

There are people with change-the-world ambition.

Then there are people who love a craft for the sake of making something excellent.

The intersection of the two are the people I like to be around.

account_circle
Tableau Public(@tableaupublic) 's Twitter Profile Photo

Bar charts don't have to be boring.

Check out this from the Vault by Robert Rouse to see different types of bar charts and get some inspiration for your next dashboard: tabsoft.co/3ONBOA3
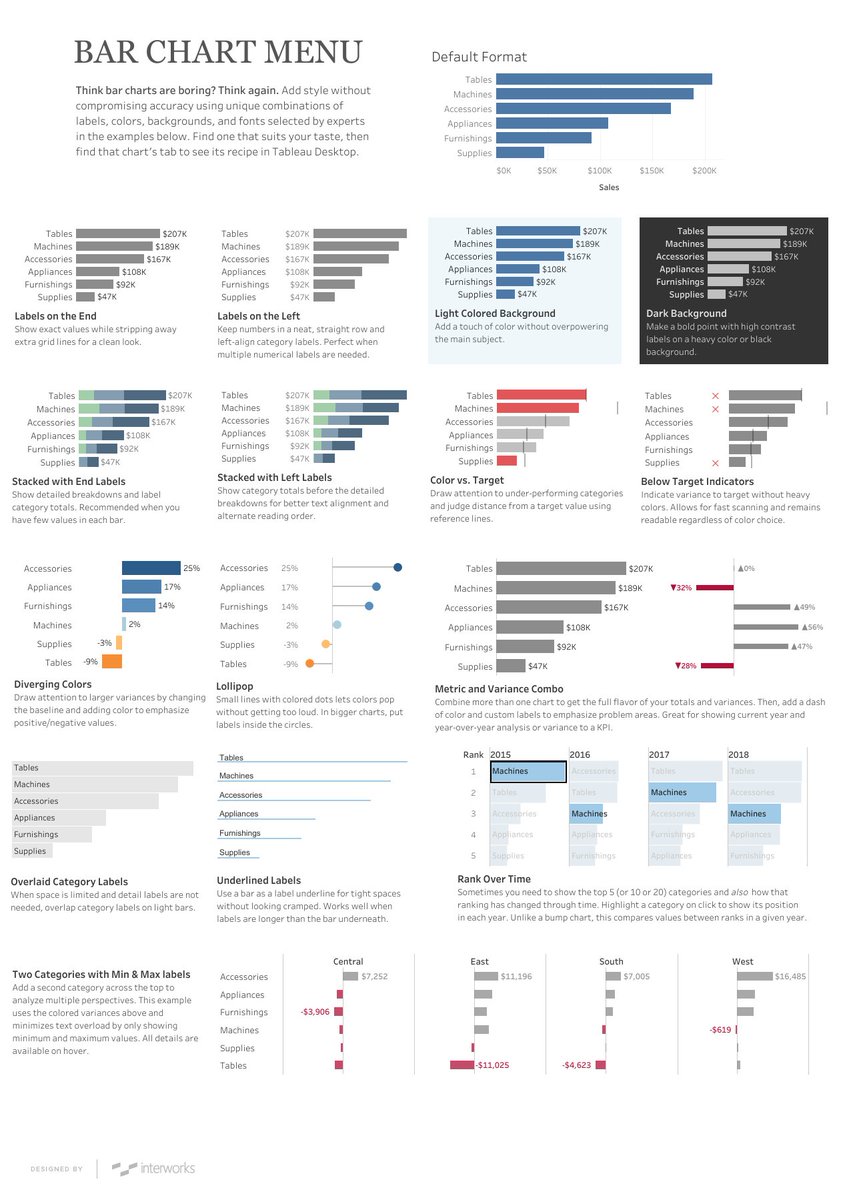
Bar charts don't have to be boring. Check out this #VizOfTheDay from the Vault by @bibleviz to see different types of bar charts and get some inspiration for your next dashboard: tabsoft.co/3ONBOA3
account_circle
Robert Rouse(@bibleviz) 's Twitter Profile Photo

Today is day 40! 🥳 ICYMI, check out the whole thread. If you know of a Bible-related data visualization that I did not include, please suggest it for addition via this form: airtable.com/appb9fpS0ExPoJ…

account_circle